Capital One 2011 Annual Report Download - page 96
Download and view the complete annual report
Please find page 96 of the 2011 Capital One annual report below. You can navigate through the pages in the report by either clicking on the pages listed below, or by using the keyword search tool below to find specific information within the annual report.-
 1
1 -
2
-
3
-
4
-
5
-
6
-
7
-
8
-
9
-
10
-
11
-
12
-
13
-
14
-
15
-
16
-
17
-
18
-
19
-
20
-
21
-
22
-
23
-
24
-
25
-
26
-
27
-
28
-
29
-
30
-
31
-
32
-
33
-
34
-
35
-
36
-
37
-
38
-
39
-
40
-
41
-
42
-
43
-
44
-
45
-
46
-
47
-
48
-
49
-
50
-
51
-
52
-
53
-
54
-
55
-
56
-
57
-
58
-
59
-
60
-
61
-
62
-
63
-
64
-
65
-
66
-
67
-
68
-
69
-
70
-
71
-
72
-
73
-
74
-
75
-
76
-
77
-
78
-
79
-
80
-
81
-
82
-
83
-
84
-
85
-
 86
86 -
 87
87 -
 88
88 -
 89
89 -
 90
90 -
 91
91 -
 92
92 -
 93
93 -
 94
94 -
 95
95 -
 96
96 -
 97
97 -
 98
98 -
 99
99 -
 100
100 -
 101
101 -
 102
102 -
 103
103 -
 104
104 -
 105
105 -
 106
106 -
107
-
108
-
109
-
110
-
111
-
112
-
113
-
114
-
115
-
116
-
117
-
118
-
119
-
120
-
121
-
122
-
123
-
124
-
125
-
126
-
127
-
128
-
129
-
130
-
131
-
132
-
133
-
134
-
135
-
136
-
137
-
138
-
139
-
140
-
141
-
142
-
143
-
144
-
145
-
146
-
147
-
148
-
149
-
150
-
151
-
152
-
153
-
154
-
155
-
156
-
157
-
158
-
159
-
160
-
161
-
162
-
163
-
164
-
165
-
166
-
167
-
168
-
169
-
170
-
171
-
172
-
173
-
174
-
175
-
176
-
177
-
178
-
179
-
180
-
181
-
182
-
183
-
184
-
185
-
186
-
187
-
188
-
189
-
190
-
191
-
192
-
193
-
194
-
195
-
196
-
197
-
198
-
199
-
200
-
201
-
202
-
203
-
204
-
205
-
206
-
207
-
208
-
209
-
210
-
211
-
212
-
213
-
214
-
215
-
216
-
217
-
218
-
219
-
220
-
221
-
222
-
223
-
224
-
225
-
226
-
227
-
228
-
229
-
230
-
231
-
232
-
233
-
234
-
235
-
236
-
237
-
238
-
239
-
240
-
241
-
242
-
243
-
244
-
245
-
246
-
247
-
248
-
249
-
250
-
251
-
252
-
253
-
254
-
255
-
256
-
257
-
258
-
259
-
260
-
261
-
262
-
263
-
264
-
265
-
266
-
267
-
268
-
269
-
270
-
271
-
272
-
273
-
274
-
275
-
276
-
277
-
278
-
279
-
280
-
281
-
282
-
283
-
284
-
285
-
286
-
287
-
288
-
289
-
290
-
291
-
292
-
293
-
294
-
295
-
296
-
297
-
298
 |
 |

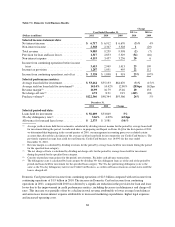
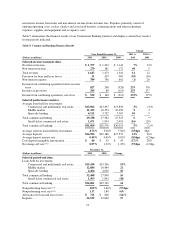
deposits to lower rates in response to the overall lower interest rate environment, and stable loan yields
despite the lower interest rate environment driven by wider spreads on new originations.
•Non-Interest Income: Non-interest income increased by $9 million, or 5%, in 2010 to $181 million, largely
attributable to growth in fees in the middle market segment, which was partially offset by a loss on the
disposition of a legacy portfolio of small-ticket commercial real estate loans.
•Provision for Loan and Lease Losses: The provision for loan and lease losses decreased by $554 million in
2010, to $429 million. The substantial reduction in the provision was attributable to improvements in
charge-off and nonperforming loan rates throughout the year, which resulted in a reduction in our allowance
build. We recorded an allowance build of $41 million in 2010, compared with an allowance build of $484
million in 2009.
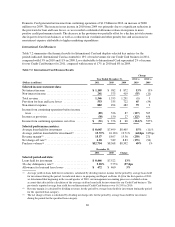
•Non-Interest Expense: Non-interest expense increased by $135 million, or 20%, in 2010 to $796 million.
The increase was attributable to higher loan workout expenses and losses related to REO, combined with
increases in core deposit intangible amortization expense, integration costs related to the Chevy Chase Bank
acquisition and expenditures related to risk management activities and enhancing our infrastructure.
•Total Loans: Period-end loans increased by $129 million, or less than 1%, to $29.7 billion as of
December 31, 2010. The slight increase was due to modest loan growth, which was partially offset by the
disposition of the legacy portfolio of small-ticket commercial real estate loans.
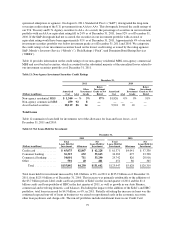
•Deposits: Period-end deposits increased by $2.1 billion, or 10%, to $22.6 billion as of December 31, 2010,
driven by our increased effort to build and expand commercial relationships.
•Charge-off and Nonperforming Loan Statistics: Credit metrics remain elevated, but have significantly
improved since the second half of 2009 as a result of the improved economic environment and our risk
management activities. The net charge-off rate decreased to 1.32% in 2010, from 1.45% in 2009. The
nonperforming loan rate declined to 1.66% as of December 31, 2010, from 2.37% as of December 31, 2009.
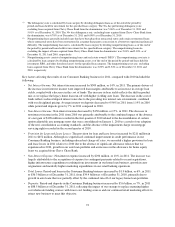
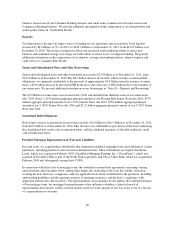
CONSOLIDATED BALANCE SHEET ANALYSIS
Total assets of $206.0 billion as of December 31, 2011 increased by $8.5 billion, or 4%, from $197.5 billion as of
December 31, 2010. Total liabilities of $176.4 billion as of December 31, 2011, increased by $5.4 billion, or 3%,
from $171.0 billion as of December 31, 2010. Stockholders’ equity increased by $3.1 billion during 2011, to
$29.7 billion as of December 31, 2011 from $26.5 billion as of December 31, 2010. The increase in stockholders’
equity was primarily attributable to our net income of $3.1 billion in 2011.
Following is a discussion of material changes in the major components of our assets and liabilities during 2011.
76