Capital One 2011 Annual Report Download - page 121
Download and view the complete annual report
Please find page 121 of the 2011 Capital One annual report below. You can navigate through the pages in the report by either clicking on the pages listed below, or by using the keyword search tool below to find specific information within the annual report.-
 1
1 -
2
-
3
-
4
-
5
-
6
-
7
-
8
-
9
-
10
-
11
-
12
-
13
-
14
-
15
-
16
-
17
-
18
-
19
-
20
-
21
-
22
-
23
-
24
-
25
-
26
-
27
-
28
-
29
-
30
-
31
-
32
-
33
-
34
-
35
-
36
-
37
-
38
-
39
-
40
-
41
-
42
-
43
-
44
-
45
-
46
-
47
-
48
-
49
-
50
-
51
-
52
-
53
-
54
-
55
-
56
-
57
-
58
-
59
-
60
-
61
-
62
-
63
-
64
-
65
-
66
-
67
-
68
-
69
-
70
-
71
-
72
-
73
-
74
-
75
-
76
-
77
-
78
-
79
-
80
-
81
-
82
-
83
-
84
-
85
-
86
-
87
-
88
-
89
-
90
-
91
-
92
-
93
-
94
-
95
-
96
-
97
-
98
-
99
-
100
-
101
-
102
-
103
-
104
-
105
-
106
-
107
-
108
-
109
-
110
-
 111
111 -
 112
112 -
 113
113 -
 114
114 -
 115
115 -
 116
116 -
 117
117 -
 118
118 -
 119
119 -
 120
120 -
 121
121 -
 122
122 -
 123
123 -
 124
124 -
 125
125 -
 126
126 -
 127
127 -
 128
128 -
 129
129 -
 130
130 -
 131
131 -
132
-
133
-
134
-
135
-
136
-
137
-
138
-
139
-
140
-
141
-
142
-
143
-
144
-
145
-
146
-
147
-
148
-
149
-
150
-
151
-
152
-
153
-
154
-
155
-
156
-
157
-
158
-
159
-
160
-
161
-
162
-
163
-
164
-
165
-
166
-
167
-
168
-
169
-
170
-
171
-
172
-
173
-
174
-
175
-
176
-
177
-
178
-
179
-
180
-
181
-
182
-
183
-
184
-
185
-
186
-
187
-
188
-
189
-
190
-
191
-
192
-
193
-
194
-
195
-
196
-
197
-
198
-
199
-
200
-
201
-
202
-
203
-
204
-
205
-
206
-
207
-
208
-
209
-
210
-
211
-
212
-
213
-
214
-
215
-
216
-
217
-
218
-
219
-
220
-
221
-
222
-
223
-
224
-
225
-
226
-
227
-
228
-
229
-
230
-
231
-
232
-
233
-
234
-
235
-
236
-
237
-
238
-
239
-
240
-
241
-
242
-
243
-
244
-
245
-
246
-
247
-
248
-
249
-
250
-
251
-
252
-
253
-
254
-
255
-
256
-
257
-
258
-
259
-
260
-
261
-
262
-
263
-
264
-
265
-
266
-
267
-
268
-
269
-
270
-
271
-
272
-
273
-
274
-
275
-
276
-
277
-
278
-
279
-
280
-
281
-
282
-
283
-
284
-
285
-
286
-
287
-
288
-
289
-
290
-
291
-
292
-
293
-
294
-
295
-
296
-
297
-
298
 |
 |

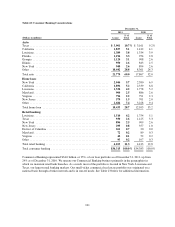
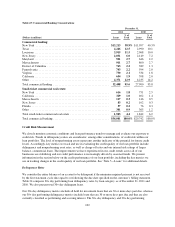
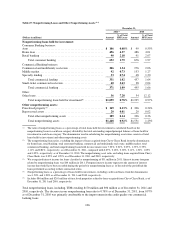
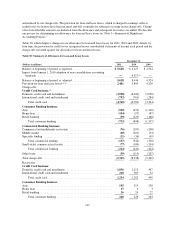
Table 22: Consumer Banking Concentrations
December 31,
2011 2010
(Dollars in millions) Loans
% of
Total Loans
% of
Total
Auto:
Texas ....................................................... $ 3,901 10.7% $ 3,161 9.2%
California ................................................... 1,837 5.1 1,412 4.1
Louisiana .................................................... 1,389 3.8 1,334 3.9
Florida ...................................................... 1,196 3.3 954 2.8
Georgia ..................................................... 1,124 3.1 908 2.6
Illinois ...................................................... 950 2.6 843 2.5
New York ................................................... 940 2.6 894 2.6
Other ....................................................... 10,442 28.8 8,361 24.3
Total auto ................................................... 21,779 60.0 17,867 52.0
Home loan:
New York ................................................... 2,046 5.7 2,380 6.9
California ................................................... 1,896 5.2 2,339 6.8
Louisiana .................................................... 1,530 4.2 1,778 5.2
Maryland .................................................... 904 2.5 886 2.6
Virginia ..................................................... 794 2.2 791 2.3
New Jersey .................................................. 579 1.5 701 2.0
Other ....................................................... 2,684 7.4 3,228 9.4
Total home loan .............................................. 10,433 28.7 12,103 35.2
Retail banking:
Louisiana .................................................... 1,514 4.2 1,754 5.1
Texas ....................................................... 930 2.6 1,125 3.3
New York ................................................... 896 2.5 909 2.6
New Jersey .................................................. 295 0.8 357 1.0
District of Columbia ........................................... 261 0.7 20 0.0
Maryland .................................................... 72 0.2 89 0.3
Virginia ..................................................... 42 0.1 52 0.2
Other ....................................................... 93 0.2 107 0.3
Total retail banking ............................................ 4,103 11.3 4,413 12.8
Total consumer banking ........................................ $36,315 100.0% $34,383 100.0%
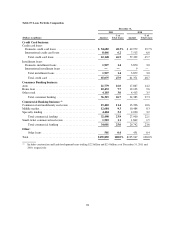
Commercial Banking represented $34.0 billion, or 25%, of our loan portfolio as of December 31, 2011, up from
24% as of December 31, 2010. We operate our Commercial Banking business primarily in the geographies in
which we maintain retail bank branches. As a result, most of the portfolio is located in New York, Louisiana and
Texas, our largest retail banking markets. Our small-ticket commercial real estate portfolio was originated on a
national basis through a broker network and is in run-off mode. See Table 23 below for additional information.
101