Capital One 2011 Annual Report Download - page 136
Download and view the complete annual report
Please find page 136 of the 2011 Capital One annual report below. You can navigate through the pages in the report by either clicking on the pages listed below, or by using the keyword search tool below to find specific information within the annual report.-
 1
1 -
2
-
3
-
4
-
5
-
6
-
7
-
8
-
9
-
10
-
11
-
12
-
13
-
14
-
15
-
16
-
17
-
18
-
19
-
20
-
21
-
22
-
23
-
24
-
25
-
26
-
27
-
28
-
29
-
30
-
31
-
32
-
33
-
34
-
35
-
36
-
37
-
38
-
39
-
40
-
41
-
42
-
43
-
44
-
45
-
46
-
47
-
48
-
49
-
50
-
51
-
52
-
53
-
54
-
55
-
56
-
57
-
58
-
59
-
60
-
61
-
62
-
63
-
64
-
65
-
66
-
67
-
68
-
69
-
70
-
71
-
72
-
73
-
74
-
75
-
76
-
77
-
78
-
79
-
80
-
81
-
82
-
83
-
84
-
85
-
86
-
87
-
88
-
89
-
90
-
91
-
92
-
93
-
94
-
95
-
96
-
97
-
98
-
99
-
100
-
101
-
102
-
103
-
104
-
105
-
106
-
107
-
108
-
109
-
110
-
111
-
112
-
113
-
114
-
115
-
116
-
117
-
118
-
119
-
120
-
121
-
122
-
123
-
124
-
125
-
 126
126 -
 127
127 -
 128
128 -
 129
129 -
 130
130 -
 131
131 -
 132
132 -
 133
133 -
 134
134 -
 135
135 -
 136
136 -
 137
137 -
 138
138 -
 139
139 -
 140
140 -
 141
141 -
 142
142 -
 143
143 -
 144
144 -
 145
145 -
 146
146 -
147
-
148
-
149
-
150
-
151
-
152
-
153
-
154
-
155
-
156
-
157
-
158
-
159
-
160
-
161
-
162
-
163
-
164
-
165
-
166
-
167
-
168
-
169
-
170
-
171
-
172
-
173
-
174
-
175
-
176
-
177
-
178
-
179
-
180
-
181
-
182
-
183
-
184
-
185
-
186
-
187
-
188
-
189
-
190
-
191
-
192
-
193
-
194
-
195
-
196
-
197
-
198
-
199
-
200
-
201
-
202
-
203
-
204
-
205
-
206
-
207
-
208
-
209
-
210
-
211
-
212
-
213
-
214
-
215
-
216
-
217
-
218
-
219
-
220
-
221
-
222
-
223
-
224
-
225
-
226
-
227
-
228
-
229
-
230
-
231
-
232
-
233
-
234
-
235
-
236
-
237
-
238
-
239
-
240
-
241
-
242
-
243
-
244
-
245
-
246
-
247
-
248
-
249
-
250
-
251
-
252
-
253
-
254
-
255
-
256
-
257
-
258
-
259
-
260
-
261
-
262
-
263
-
264
-
265
-
266
-
267
-
268
-
269
-
270
-
271
-
272
-
273
-
274
-
275
-
276
-
277
-
278
-
279
-
280
-
281
-
282
-
283
-
284
-
285
-
286
-
287
-
288
-
289
-
290
-
291
-
292
-
293
-
294
-
295
-
296
-
297
-
298
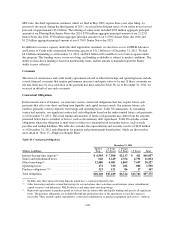
 |
 |

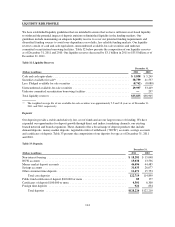
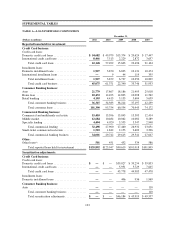
December 31, 2010
(Dollars in millions)
Period End
Balance
Average
Balance
Interest
Expense
% of
Average
Deposits
Average
Deposit
Rate
Non-interest bearing ................................ $ 15,048 $ 14,267 N/A 12.0% N/A
NOW accounts .................................... 13,536 12,032 $ 36 10.1 0.30%
Money market deposit accounts ....................... 44,485 42,159 409 35.4 0.97
Savings accounts .................................. 26,077 21,854 188 18.4 0.86
Other consumer time deposits ........................ 15,753 20,655 585 17.4 2.83
Total core deposits ............................. 114,899 110,967 1,218 93.3 1.10
Public fund certificates of deposit of $100,000 or more . . . . 177 265 5 0.2 2.03
Certificates of deposit of $100,000 or more .............. 6,300 6,912 237 5.8 3.43
Foreign time deposits ............................... 834 866 5 0.7 0.57
Total deposits ................................. $122,210 $119,010 $1,465 100.0% 1.23%
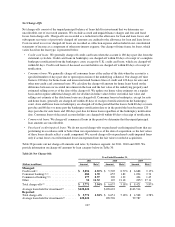
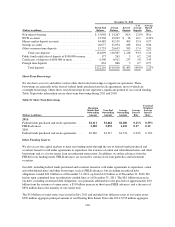
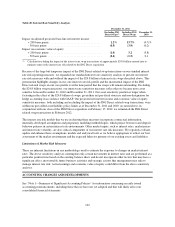
Short-Term Borrowings
We also have access to and utilize various other short-term borrowings to support our operations. These
borrowings are generally in the form of federal funds purchased and resale agreements, most of which are
overnight borrowings. Other short- term borrowings do not represent a significant portion of our overall funding.
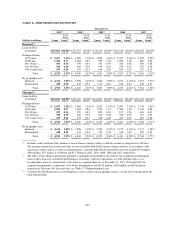
Table 36 provides information on our short-term borrowing during 2011 and 2010.
Table 36: Short-Term Borrowings
(Dollars in millions)
Maximum
Month-End
Outstanding
Amount
Year-End
Outstanding
Amount
Average
Outstanding
Amount
Average
Interest
Rate
Year-End
Weighted
Average
Interest
Rate
2011:
Federal funds purchased and resale agreements ..... $2,111 $1,464 $2,186 0.21% 0.35%
FHLB advances .............................. 5,385 5,835 1,110 0.17 0.13
2010:
Federal funds purchased and resale agreements ..... $2,469 $1,517 $1,731 0.23% 0.13%
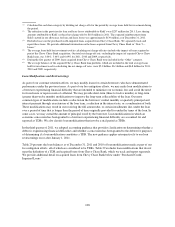
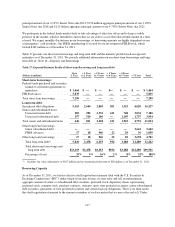
Other Funding Sources
We also access the capital markets to meet our funding needs through the use of federal funds purchased and
securities loaned or sold under agreements to repurchase, the issuance of senior and subordinated notes and other
borrowings and, to a lesser extent, loan securitization transactions. In addition, we utilize advances from the
FHLB for our funding needs. FHLB advances are secured by certain of our loan portfolios and investment
securities.
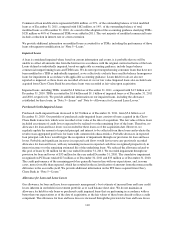
Our debt, including federal funds purchased and securities loaned or sold under agreements to repurchase, senior
and subordinated notes and other borrowings, such as FHLB advances, but excluding securitized debt
obligations, totaled $23.0 billion as of December 31, 2011, up from $14.9 billion as of December 31, 2010. We
had no open committed loan securitization conduit lines as of December 31, 2011. The $8.1 billion increase in
our debt, excluding securitized debt obligations, was primarily attributable to the proceeds of approximately $3.0
billion from the issuance of senior notes, a $5.8 billion increase in short term FHLB advances, and a decrease of
$854 million due to the maturity of one senior note.
The $3.0 billion of senior notes were issued in July 2011 and included four different series of our senior notes:
$250 million aggregate principal amount of our Floating Rate Senior Notes due 2014; $750 million aggregate
116