Capital One 2011 Annual Report Download - page 154
Download and view the complete annual report
Please find page 154 of the 2011 Capital One annual report below. You can navigate through the pages in the report by either clicking on the pages listed below, or by using the keyword search tool below to find specific information within the annual report.-
 1
1 -
2
-
3
-
4
-
5
-
6
-
7
-
8
-
9
-
10
-
11
-
12
-
13
-
14
-
15
-
16
-
17
-
18
-
19
-
20
-
21
-
22
-
23
-
24
-
25
-
26
-
27
-
28
-
29
-
30
-
31
-
32
-
33
-
34
-
35
-
36
-
37
-
38
-
39
-
40
-
41
-
42
-
43
-
44
-
45
-
46
-
47
-
48
-
49
-
50
-
51
-
52
-
53
-
54
-
55
-
56
-
57
-
58
-
59
-
60
-
61
-
62
-
63
-
64
-
65
-
66
-
67
-
68
-
69
-
70
-
71
-
72
-
73
-
74
-
75
-
76
-
77
-
78
-
79
-
80
-
81
-
82
-
83
-
84
-
85
-
86
-
87
-
88
-
89
-
90
-
91
-
92
-
93
-
94
-
95
-
96
-
97
-
98
-
99
-
100
-
101
-
102
-
103
-
104
-
105
-
106
-
107
-
108
-
109
-
110
-
111
-
112
-
113
-
114
-
115
-
116
-
117
-
118
-
119
-
120
-
121
-
122
-
123
-
124
-
125
-
126
-
127
-
128
-
129
-
130
-
131
-
132
-
133
-
134
-
135
-
136
-
137
-
138
-
139
-
140
-
141
-
142
-
143
-
 144
144 -
 145
145 -
 146
146 -
 147
147 -
 148
148 -
 149
149 -
 150
150 -
 151
151 -
 152
152 -
 153
153 -
 154
154 -
 155
155 -
 156
156 -
 157
157 -
 158
158 -
 159
159 -
 160
160 -
 161
161 -
 162
162 -
 163
163 -
 164
164 -
165
-
166
-
167
-
168
-
169
-
170
-
171
-
172
-
173
-
174
-
175
-
176
-
177
-
178
-
179
-
180
-
181
-
182
-
183
-
184
-
185
-
186
-
187
-
188
-
189
-
190
-
191
-
192
-
193
-
194
-
195
-
196
-
197
-
198
-
199
-
200
-
201
-
202
-
203
-
204
-
205
-
206
-
207
-
208
-
209
-
210
-
211
-
212
-
213
-
214
-
215
-
216
-
217
-
218
-
219
-
220
-
221
-
222
-
223
-
224
-
225
-
226
-
227
-
228
-
229
-
230
-
231
-
232
-
233
-
234
-
235
-
236
-
237
-
238
-
239
-
240
-
241
-
242
-
243
-
244
-
245
-
246
-
247
-
248
-
249
-
250
-
251
-
252
-
253
-
254
-
255
-
256
-
257
-
258
-
259
-
260
-
261
-
262
-
263
-
264
-
265
-
266
-
267
-
268
-
269
-
270
-
271
-
272
-
273
-
274
-
275
-
276
-
277
-
278
-
279
-
280
-
281
-
282
-
283
-
284
-
285
-
286
-
287
-
288
-
289
-
290
-
291
-
292
-
293
-
294
-
295
-
296
-
297
-
298
 |
 |

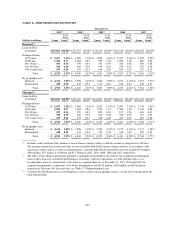
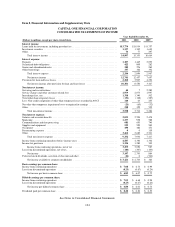
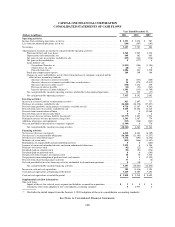
Item 8. Financial Information and Supplementary Data
CAPITAL ONE FINANCIAL CORPORATION
CONSOLIDATED STATEMENTS OF INCOME
Year Ended December 31,
(Dollars in millions, except per share-related data) 2011 2010 2009
Interest income:
Loans held for investment, including past-due fees ..................................... $13,774 $13,934 $ 8,757
Investment securities ............................................................ 1,137 1,342 1,610
Other ......................................................................... 76 77 297
Total interest income ........................................................ 14,987 15,353 10,664
Interest expense:
Deposits ...................................................................... 1,187 1,465 2,093
Securitized debt obligations ....................................................... 422 809 282
Senior and subordinated notes ..................................................... 300 276 260
Other borrowings ............................................................... 337 346 332
Total interest expense ........................................................ 2,246 2,896 2,967
Net interest income .......................................................... 12,741 12,457 7,697
Provision for loan and lease losses .................................................. 2,360 3,907 4,230
Net interest income after provision for loan and lease losses ......................... 10,381 8,550 3,467
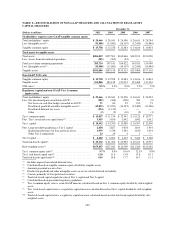
Non-interest income:
Servicing and securitizations ...................................................... 44 7 2,280
Service charges and other customer-related fees ....................................... 1,979 2,073 1,997
Interchange fees, net ............................................................. 1,318 1,340 502
Total other-than-temporary losses .................................................. (131) (128) (287)
Less: Non-credit component of other-than-temporary losses recorded in AOCI .............. 110 63 255
Net other-than-temporary impairment losses recognized in earnings ....................... (21) (65) (32)
Other ......................................................................... 218 359 539
Total non-interest income ..................................................... 3,538 3,714 5,286
Non-interest expense:
Salaries and associate benefits ..................................................... 3,023 2,594 2,478
Marketing ..................................................................... 1,337 958 588
Communications and data processing ............................................... 681 693 740
Supplies and equipment .......................................................... 539 520 500
Occupancy .................................................................... 490 486 451
Restructuring expense ........................................................... 00 119
Other ......................................................................... 3,262 2,683 2,541
Total non-interest expense .................................................... 9,332 7,934 7,417
Income from continuing operations before income taxes ................................ 4,587 4,330 1,336
Income tax provision ............................................................ 1,334 1,280 349
Income from continuing operations, net of tax .................................... 3,253 3,050 987
Loss from discontinued operations, net of tax ......................................... (106) (307) (103)
Net income ................................................................ 3,147 2,743 884
Preferred stock dividends, accretion of discount and other ............................... (26) 0 (564)
Net income available to common stockholders .................................... $ 3,121 $ 2,743 $ 320
Basic earnings per common share:
Income from continuing operations ................................................. $ 7.08 $ 6.74 $ 0.99
Loss from discontinued operations ................................................. (0.23) (0.67) (0.24)
Net income per basic common share ............................................ $ 6.85 $ 6.07 $ 0.75
Diluted earnings per common share:
Income from continuing operations ................................................. $ 7.03 $ 6.68 $ 0.98
Loss from discontinued operations ................................................. (0.23) (0.67) (0.24)
Net income per diluted common share ........................................... $ 6.80 $ 6.01 $ 0.74
Dividends paid per common share .................................................. $ 0.20 $ 0.20 $ 0.53
See Notes to Consolidated Financial Statements.
134