Capital One 2011 Annual Report Download - page 180
Download and view the complete annual report
Please find page 180 of the 2011 Capital One annual report below. You can navigate through the pages in the report by either clicking on the pages listed below, or by using the keyword search tool below to find specific information within the annual report.-
 1
1 -
2
-
3
-
4
-
5
-
6
-
7
-
8
-
9
-
10
-
11
-
12
-
13
-
14
-
15
-
16
-
17
-
18
-
19
-
20
-
21
-
22
-
23
-
24
-
25
-
26
-
27
-
28
-
29
-
30
-
31
-
32
-
33
-
34
-
35
-
36
-
37
-
38
-
39
-
40
-
41
-
42
-
43
-
44
-
45
-
46
-
47
-
48
-
49
-
50
-
51
-
52
-
53
-
54
-
55
-
56
-
57
-
58
-
59
-
60
-
61
-
62
-
63
-
64
-
65
-
66
-
67
-
68
-
69
-
70
-
71
-
72
-
73
-
74
-
75
-
76
-
77
-
78
-
79
-
80
-
81
-
82
-
83
-
84
-
85
-
86
-
87
-
88
-
89
-
90
-
91
-
92
-
93
-
94
-
95
-
96
-
97
-
98
-
99
-
100
-
101
-
102
-
103
-
104
-
105
-
106
-
107
-
108
-
109
-
110
-
111
-
112
-
113
-
114
-
115
-
116
-
117
-
118
-
119
-
120
-
121
-
122
-
123
-
124
-
125
-
126
-
127
-
128
-
129
-
130
-
131
-
132
-
133
-
134
-
135
-
136
-
137
-
138
-
139
-
140
-
141
-
142
-
143
-
144
-
145
-
146
-
147
-
148
-
149
-
150
-
151
-
152
-
153
-
154
-
155
-
156
-
157
-
158
-
159
-
160
-
161
-
162
-
163
-
164
-
165
-
166
-
167
-
168
-
169
-
 170
170 -
 171
171 -
 172
172 -
 173
173 -
 174
174 -
 175
175 -
 176
176 -
 177
177 -
 178
178 -
 179
179 -
 180
180 -
 181
181 -
 182
182 -
 183
183 -
 184
184 -
 185
185 -
 186
186 -
 187
187 -
 188
188 -
 189
189 -
 190
190 -
191
-
192
-
193
-
194
-
195
-
196
-
197
-
198
-
199
-
200
-
201
-
202
-
203
-
204
-
205
-
206
-
207
-
208
-
209
-
210
-
211
-
212
-
213
-
214
-
215
-
216
-
217
-
218
-
219
-
220
-
221
-
222
-
223
-
224
-
225
-
226
-
227
-
228
-
229
-
230
-
231
-
232
-
233
-
234
-
235
-
236
-
237
-
238
-
239
-
240
-
241
-
242
-
243
-
244
-
245
-
246
-
247
-
248
-
249
-
250
-
251
-
252
-
253
-
254
-
255
-
256
-
257
-
258
-
259
-
260
-
261
-
262
-
263
-
264
-
265
-
266
-
267
-
268
-
269
-
270
-
271
-
272
-
273
-
274
-
275
-
276
-
277
-
278
-
279
-
280
-
281
-
282
-
283
-
284
-
285
-
286
-
287
-
288
-
289
-
290
-
291
-
292
-
293
-
294
-
295
-
296
-
297
-
298
 |
 |

CAPITAL ONE FINANCIAL CORPORATION
NOTES TO CONSOLIDATED STATEMENTS—(Continued)
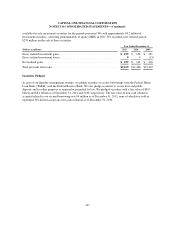
The loss from discontinued operations includes an expense of $169 million ($120 million net of tax), $432
million ($304 million net of tax) and $162 million ($120 million net of tax) for the years ended December 31,
2011, 2010 and 2009, respectively, primarily attributable to provisions for mortgage loan repurchase losses
related to representations and warranties provided on loans previously sold to third parties by the wholesale
banking unit.
The discontinued mortgage origination operations of our wholesale home loan banking unit had remaining assets
of $304 million and $362 million as of December 31, 2011 and 2010, respectively, which consisted primarily of
income tax receivables. Liabilities totaled $680 million and $585 million as of December 31, 2011 and 2010,
respectively consisting primarily of reserves for representations and warranties on loans previously sold to third
parties.
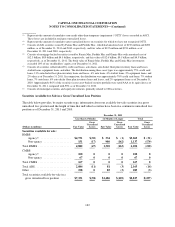
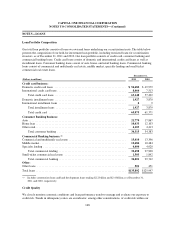
NOTE 4—INVESTMENT SECURITIES
Our investment securities portfolio, which had a fair value of $38.8 billion and $41.5 billion, as of December 31,
2011 and 2010, respectively, consists of U.S. Treasury and U.S. agency debt obligations; agency and non-agency
residential and commercial mortgage-backed securities; other asset-backed securities collateralized primarily by
credit card loans, auto loans and leases, student loans, auto dealer floor plan inventory loans and leases,
equipment loans, and other; municipal securities and limited Community Reinvestment Act (“CRA”) equity
securities. Our investment securities portfolio continues to be heavily concentrated in securities that generally
have lower credit risk and high credit ratings, such as securities issued and guaranteed by the U.S. Treasury and
government sponsored enterprises or agencies. Our investments in U.S. Treasury and agency securities, based on
fair value, represented 69% of our total investment securities portfolio as of December 31, 2011, compared with
70% as of December 31, 2010.
160