Capital One 2011 Annual Report Download - page 149
Download and view the complete annual report
Please find page 149 of the 2011 Capital One annual report below. You can navigate through the pages in the report by either clicking on the pages listed below, or by using the keyword search tool below to find specific information within the annual report.-
 1
1 -
2
-
3
-
4
-
5
-
6
-
7
-
8
-
9
-
10
-
11
-
12
-
13
-
14
-
15
-
16
-
17
-
18
-
19
-
20
-
21
-
22
-
23
-
24
-
25
-
26
-
27
-
28
-
29
-
30
-
31
-
32
-
33
-
34
-
35
-
36
-
37
-
38
-
39
-
40
-
41
-
42
-
43
-
44
-
45
-
46
-
47
-
48
-
49
-
50
-
51
-
52
-
53
-
54
-
55
-
56
-
57
-
58
-
59
-
60
-
61
-
62
-
63
-
64
-
65
-
66
-
67
-
68
-
69
-
70
-
71
-
72
-
73
-
74
-
75
-
76
-
77
-
78
-
79
-
80
-
81
-
82
-
83
-
84
-
85
-
86
-
87
-
88
-
89
-
90
-
91
-
92
-
93
-
94
-
95
-
96
-
97
-
98
-
99
-
100
-
101
-
102
-
103
-
104
-
105
-
106
-
107
-
108
-
109
-
110
-
111
-
112
-
113
-
114
-
115
-
116
-
117
-
118
-
119
-
120
-
121
-
122
-
123
-
124
-
125
-
126
-
127
-
128
-
129
-
130
-
131
-
132
-
133
-
134
-
135
-
136
-
137
-
138
-
 139
139 -
 140
140 -
 141
141 -
 142
142 -
 143
143 -
 144
144 -
 145
145 -
 146
146 -
 147
147 -
 148
148 -
 149
149 -
 150
150 -
 151
151 -
 152
152 -
 153
153 -
 154
154 -
 155
155 -
 156
156 -
 157
157 -
 158
158 -
 159
159 -
160
-
161
-
162
-
163
-
164
-
165
-
166
-
167
-
168
-
169
-
170
-
171
-
172
-
173
-
174
-
175
-
176
-
177
-
178
-
179
-
180
-
181
-
182
-
183
-
184
-
185
-
186
-
187
-
188
-
189
-
190
-
191
-
192
-
193
-
194
-
195
-
196
-
197
-
198
-
199
-
200
-
201
-
202
-
203
-
204
-
205
-
206
-
207
-
208
-
209
-
210
-
211
-
212
-
213
-
214
-
215
-
216
-
217
-
218
-
219
-
220
-
221
-
222
-
223
-
224
-
225
-
226
-
227
-
228
-
229
-
230
-
231
-
232
-
233
-
234
-
235
-
236
-
237
-
238
-
239
-
240
-
241
-
242
-
243
-
244
-
245
-
246
-
247
-
248
-
249
-
250
-
251
-
252
-
253
-
254
-
255
-
256
-
257
-
258
-
259
-
260
-
261
-
262
-
263
-
264
-
265
-
266
-
267
-
268
-
269
-
270
-
271
-
272
-
273
-
274
-
275
-
276
-
277
-
278
-
279
-
280
-
281
-
282
-
283
-
284
-
285
-
286
-
287
-
288
-
289
-
290
-
291
-
292
-
293
-
294
-
295
-
296
-
297
-
298
 |
 |
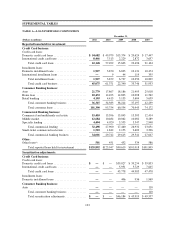
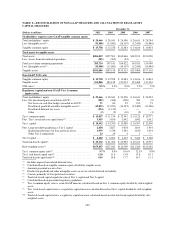
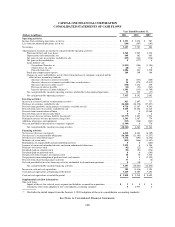
TABLE F—RECONCILIATION OF NON-GAAP MEASURES AND CALCULATION OF REGULATORY
CAPITAL MEASURES
December 31,
(Dollars in millions) 2011 2010 2009 2008 2007
Stockholders’ equity to non-GAAP tangible common equity
Total stockholders’ equity ............................... $ 29,666 $ 26,541 $ 26,590 $ 26,611 $ 24,294
Less: Intangible assets(1) ................................. (13,908) (13,983) (14,107) (12,445) (13,480)
Tangible common equity ................................ $ 15,758 $ 12,558 $ 12,483 $ 14,166 $ 10,814
Total assets to tangible assets
Total assets ........................................... $206,019 $197,503 $169,646 $165,913 $150,590
Less: Assets from discontinued operations .................. (305) (362) (24) — —
Total assets from continuing operations ..................... 205,714 197,141 169,622 165,913 150,590
Less: Intangible assets(1) ................................. (13,908) (13,983) (14,107) (12,445) (13,480)
Tangible assets ........................................ $191,806 $183,158 $155,515 $153,468 $137,110
Non-GAAP TCE ratio
Tangible common equity ................................ $ 15,758 $ 12,558 $ 12,483 $ 14,166 $ 10,814
Tangible assets ........................................ 191,806 183,158 155,515 153,468 137,110
TCE ratio(2) ........................................... 8.2% 6.9% 8.0% 9.2% 7.9%
Regulatory capital and non-GAAP Tier 1 common
equity ratios
Total stockholders’ equity ............................... $ 29,666 $ 26,541 $ 26,590 $ 26,611 $ 24,294
Less: Net unrealized gains recorded in AOCI(3) ............... (289) (368) (200) 783 (9)
Net losses on cash flow hedges recorded in AOCI(3) ...... 71 86 92 215 73
Disallowed goodwill and other intangible assets(4) ........ (13,855) (13,953) (14,125) (12,482) (13,580)
Disallowed deferred tax assets ....................... (534) (1,150) — — —
Other ........................................... (2) (2) (10) (2) (1)
Tier 1 common equity .................................. $ 15,057 $ 11,154 $ 12,347 $ 15,125 $ 10,777
Plus: Tier 1 restricted core capital items(5) ................... 3,635 3,636 3,642 1,642 1,632
Tier 1 capital .......................................... $ 18,692 $ 14,790 $ 15,989 $ 16,767 $ 12,409
Plus: Long-term debt qualifying as Tier 2 capital ............. 2,438 2,827 3,018 1,813 1,934
Qualifying allowance for loan and lease losses .......... 1,979 3,748 1,581 1,630 1,634
Other Tier 2 components ........................... 23 2941—
Tier 2 capital .......................................... $ 4,440 $ 6,604 $ 4,603 $ 3,444 $ 3,568
Total risk-based capital(6) ................................ $ 23,132 $ 21,394 $ 20,592 $ 20,211 $ 15,977
Risk-weighted assets(7) .................................. $155,657 $127,043 $116,309 $121,380 $122,456
Tier 1 common equity ratio(8) ............................. 9.7% 8.8% 10.6% 12.5% 8.8%
Tier 1 risk-based capital ratio(9) ........................... 12.0 11.6 13.8 13.8 10.1
Total risk-based capital ratio(10) ........................... 14.9 16.8 17.7 16.7 13.1
(1) Includes impact from related deferred taxes.
(2) Calculated based on tangible common equity divided by tangible assets.
(3) Amounts presented are net of tax.
(4) Disallowed goodwill and other intangible assets are net of related deferred tax liability.
(5) Consists primarily of trust preferred securities.
(6) Total risk-based capital equals the sum of Tier 1 capital and Tier 2 capital.
(7) Calculated based on prescribed regulatory guidelines.
(8) Tier 1 common equity ratio is a non-GAAP measure calculated based on Tier 1 common equity divided by risk-weighted
assets.
(9) Tier 1 risk-based capital ratio is a regulatory capital measure calculated based on Tier 1 capital divided by risk-weighted
assets.
(10) Total risk-based capital ratio is a regulatory capital measure calculated based on total risk-based capital divided by risk-
weighted assets.
129