Capital One 2011 Annual Report Download - page 216
Download and view the complete annual report
Please find page 216 of the 2011 Capital One annual report below. You can navigate through the pages in the report by either clicking on the pages listed below, or by using the keyword search tool below to find specific information within the annual report.-
 1
1 -
2
-
3
-
4
-
5
-
6
-
7
-
8
-
9
-
10
-
11
-
12
-
13
-
14
-
15
-
16
-
17
-
18
-
19
-
20
-
21
-
22
-
23
-
24
-
25
-
26
-
27
-
28
-
29
-
30
-
31
-
32
-
33
-
34
-
35
-
36
-
37
-
38
-
39
-
40
-
41
-
42
-
43
-
44
-
45
-
46
-
47
-
48
-
49
-
50
-
51
-
52
-
53
-
54
-
55
-
56
-
57
-
58
-
59
-
60
-
61
-
62
-
63
-
64
-
65
-
66
-
67
-
68
-
69
-
70
-
71
-
72
-
73
-
74
-
75
-
76
-
77
-
78
-
79
-
80
-
81
-
82
-
83
-
84
-
85
-
86
-
87
-
88
-
89
-
90
-
91
-
92
-
93
-
94
-
95
-
96
-
97
-
98
-
99
-
100
-
101
-
102
-
103
-
104
-
105
-
106
-
107
-
108
-
109
-
110
-
111
-
112
-
113
-
114
-
115
-
116
-
117
-
118
-
119
-
120
-
121
-
122
-
123
-
124
-
125
-
126
-
127
-
128
-
129
-
130
-
131
-
132
-
133
-
134
-
135
-
136
-
137
-
138
-
139
-
140
-
141
-
142
-
143
-
144
-
145
-
146
-
147
-
148
-
149
-
150
-
151
-
152
-
153
-
154
-
155
-
156
-
157
-
158
-
159
-
160
-
161
-
162
-
163
-
164
-
165
-
166
-
167
-
168
-
169
-
170
-
171
-
172
-
173
-
174
-
175
-
176
-
177
-
178
-
179
-
180
-
181
-
182
-
183
-
184
-
185
-
186
-
187
-
188
-
189
-
190
-
191
-
192
-
193
-
194
-
195
-
196
-
197
-
198
-
199
-
200
-
201
-
202
-
203
-
204
-
205
-
 206
206 -
 207
207 -
 208
208 -
 209
209 -
 210
210 -
 211
211 -
 212
212 -
 213
213 -
 214
214 -
 215
215 -
 216
216 -
 217
217 -
 218
218 -
 219
219 -
 220
220 -
 221
221 -
 222
222 -
 223
223 -
 224
224 -
 225
225 -
 226
226 -
227
-
228
-
229
-
230
-
231
-
232
-
233
-
234
-
235
-
236
-
237
-
238
-
239
-
240
-
241
-
242
-
243
-
244
-
245
-
246
-
247
-
248
-
249
-
250
-
251
-
252
-
253
-
254
-
255
-
256
-
257
-
258
-
259
-
260
-
261
-
262
-
263
-
264
-
265
-
266
-
267
-
268
-
269
-
270
-
271
-
272
-
273
-
274
-
275
-
276
-
277
-
278
-
279
-
280
-
281
-
282
-
283
-
284
-
285
-
286
-
287
-
288
-
289
-
290
-
291
-
292
-
293
-
294
-
295
-
296
-
297
-
298
 |
 |

CAPITAL ONE FINANCIAL CORPORATION
NOTES TO CONSOLIDATED STATEMENTS—(Continued)
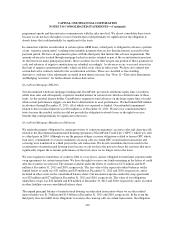
ranged from 10.0% to 14.1%. The key inputs into the discounted cash flow analysis were corroborated with
market data, where available, indicating that assumptions used were within a reasonable range of observable
market data.
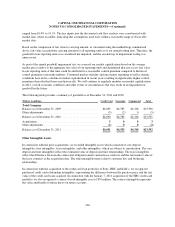
Based on the comparison of fair value to carrying amount, as calculated using the methodology summarized
above, fair value exceeded the carrying amount for all reporting units as of our annual testing date. Therefore, the
goodwill of our reporting units was considered not impaired, and the second step of impairment testing was
unnecessary.
As part of the annual goodwill impairment test, we assessed our market capitalization based on the average
market price relative to the aggregate fair value of our reporting units and determined that any excess fair value
in our reporting units at that time could be attributed to a reasonable control premium compared to historical
control premiums seen in the industry. Continued market volatility and uncertainty regarding overall economic
conditions have led to a decline in market capitalization in recent years resulting in significantly higher control
premiums than what had been seen historically. We will continue to regularly monitor our market capitalization
in 2012, overall economic conditions and other events or circumstances that may result in an impairment of
goodwill in the future.
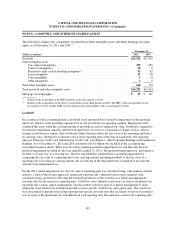
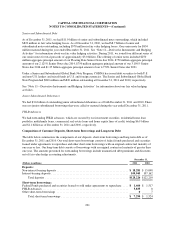
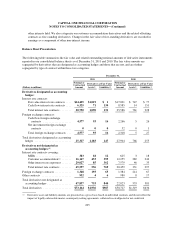
The following table provides a summary of goodwill as of December 31, 2011 and 2010:
(Dollars in millions) Credit Card Consumer Commercial Total
Total Company
Balance as of December 31, 2009 ......................... $4,693 $4,585 $4,318 $13,596
Other adjustments ...................................... (3) (2) 0 (5)
Balance as of December 31, 2010 ......................... $4,690 $4,583 $4,318 $13,591
Acquisitions .......................................... 3003
Other adjustments ...................................... (2) 0 0 (2)
Balance as of December 31, 2011 ......................... $4,691 $4,583 $4,318 $13,592
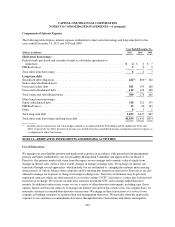
Other Intangible Assets
In connection with the prior acquisitions, we recorded intangible assets which consisted of core deposit
intangibles, trust intangibles, lease intangibles, and other intangibles, which are subject to amortization. The core
deposit and trust intangibles reflect the estimated value of deposit and trust relationships. The lease intangibles
reflect the difference between the contractual obligation under current lease contracts and the fair market value of
the lease contracts at the acquisition date. The other intangible items relate to customer lists and brokerage
relationships.
In connection with the acquisition of the credit card loan portfolios of Sony, HBC and Kohl’s, we recognized
purchased credit card relationship intangibles, representing the difference between the purchase price and the fair
value of the credit card loans acquired. In connection with the January 7, 2011 acquisition of the HBC credit card
portfolio, we also recognized a contract-based intangible asset of $70 million. The contract intangible represents
the value attributable to future draws on future accounts.
196