Capital One 2011 Annual Report Download - page 122
Download and view the complete annual report
Please find page 122 of the 2011 Capital One annual report below. You can navigate through the pages in the report by either clicking on the pages listed below, or by using the keyword search tool below to find specific information within the annual report.-
 1
1 -
2
-
3
-
4
-
5
-
6
-
7
-
8
-
9
-
10
-
11
-
12
-
13
-
14
-
15
-
16
-
17
-
18
-
19
-
20
-
21
-
22
-
23
-
24
-
25
-
26
-
27
-
28
-
29
-
30
-
31
-
32
-
33
-
34
-
35
-
36
-
37
-
38
-
39
-
40
-
41
-
42
-
43
-
44
-
45
-
46
-
47
-
48
-
49
-
50
-
51
-
52
-
53
-
54
-
55
-
56
-
57
-
58
-
59
-
60
-
61
-
62
-
63
-
64
-
65
-
66
-
67
-
68
-
69
-
70
-
71
-
72
-
73
-
74
-
75
-
76
-
77
-
78
-
79
-
80
-
81
-
82
-
83
-
84
-
85
-
86
-
87
-
88
-
89
-
90
-
91
-
92
-
93
-
94
-
95
-
96
-
97
-
98
-
99
-
100
-
101
-
102
-
103
-
104
-
105
-
106
-
107
-
108
-
109
-
110
-
111
-
 112
112 -
 113
113 -
 114
114 -
 115
115 -
 116
116 -
 117
117 -
 118
118 -
 119
119 -
 120
120 -
 121
121 -
 122
122 -
 123
123 -
 124
124 -
 125
125 -
 126
126 -
 127
127 -
 128
128 -
 129
129 -
 130
130 -
 131
131 -
 132
132 -
133
-
134
-
135
-
136
-
137
-
138
-
139
-
140
-
141
-
142
-
143
-
144
-
145
-
146
-
147
-
148
-
149
-
150
-
151
-
152
-
153
-
154
-
155
-
156
-
157
-
158
-
159
-
160
-
161
-
162
-
163
-
164
-
165
-
166
-
167
-
168
-
169
-
170
-
171
-
172
-
173
-
174
-
175
-
176
-
177
-
178
-
179
-
180
-
181
-
182
-
183
-
184
-
185
-
186
-
187
-
188
-
189
-
190
-
191
-
192
-
193
-
194
-
195
-
196
-
197
-
198
-
199
-
200
-
201
-
202
-
203
-
204
-
205
-
206
-
207
-
208
-
209
-
210
-
211
-
212
-
213
-
214
-
215
-
216
-
217
-
218
-
219
-
220
-
221
-
222
-
223
-
224
-
225
-
226
-
227
-
228
-
229
-
230
-
231
-
232
-
233
-
234
-
235
-
236
-
237
-
238
-
239
-
240
-
241
-
242
-
243
-
244
-
245
-
246
-
247
-
248
-
249
-
250
-
251
-
252
-
253
-
254
-
255
-
256
-
257
-
258
-
259
-
260
-
261
-
262
-
263
-
264
-
265
-
266
-
267
-
268
-
269
-
270
-
271
-
272
-
273
-
274
-
275
-
276
-
277
-
278
-
279
-
280
-
281
-
282
-
283
-
284
-
285
-
286
-
287
-
288
-
289
-
290
-
291
-
292
-
293
-
294
-
295
-
296
-
297
-
298
 |
 |

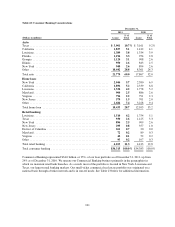
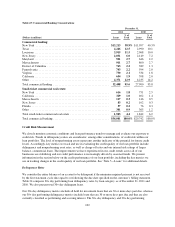
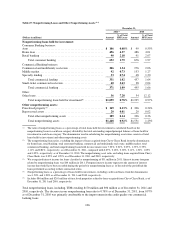
Table 23: Commercial Banking Concentrations
December 31,
2011 2010
(Dollars in millions) Loans
% of
Total Loans
% of
Total
Commercial lending:
New York ................................................... $13,213 38.9% $11,997 40.3%
Texas ....................................................... 4,246 12.5 2,990 10.1
Louisiana .................................................... 3,915 11.5 2,968 10.0
New Jersey .................................................. 2,031 6.0 2,149 7.2
Maryland .................................................... 921 2.7 646 2.2
Massachusetts ................................................ 911 2.7 800 2.7
District of Columbia ........................................... 763 2.2 389 1.3
Pennsylvania ................................................. 743 2.2 594 2.0
Virginia ..................................................... 730 2.1 534 1.8
California .................................................... 654 1.9 598 2.0
Other ....................................................... 4,371 12.9 4,235 14.2
Total commercial lending ....................................... 32,498 95.6 27,900 93.8
Small-ticket commercial real estate:
New York ................................................... 616 1.8 751 2.5
California .................................................... 329 1.0 402 1.4
Massachusetts ................................................ 117 0.3 146 0.5
New Jersey .................................................. 83 0.2 102 0.3
Florida ...................................................... 57 0.2 76 0.3
Other ....................................................... 301 0.9 365 1.2
Total small-ticket commercial real estate ........................... 1,503 4.4 1,842 6.2
Total commercial banking ....................................... $34,001 100.0% $29,742 100.0%
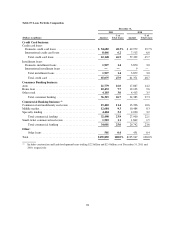
Credit Risk Measurement
We closely monitor economic conditions and loan performance trends to manage and evaluate our exposure to
credit risk. Trends in delinquency ratios are an indicator, among other considerations, of credit risk within our
loan portfolios. The level of nonperforming assets represents another indicator of the potential for future credit
losses. Accordingly, key metrics we track and use in evaluating the credit quality of our loan portfolio include
delinquency and nonperforming asset rates, as well as charge-off rates and our internal risk ratings of larger
balance, commercial loans. The improvements we have experienced in our credit trends across all of our
businesses are stabilizing and our credit performance is increasingly driven by seasonal trends. We present
information in the section below on the credit performance of our loan portfolio, including the key metrics we
use in tracking changes in the credit quality of our loan portfolio. See “Note 5—Loans” for additional details.
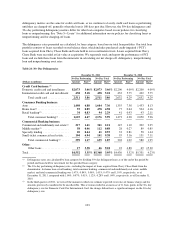
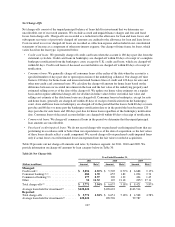
Delinquency Rates
We consider the entire balance of an account to be delinquent if the minimum required payment is not received
by the first statement cycle date equal to or following the due date specified on the customer’s billing statement.
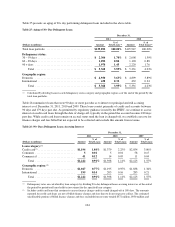
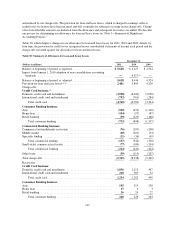
Table 24 compares 30+ day performing loan delinquency rates, by loan category, as of December 31, 2011 and
2010. We also present total 30+ day delinquent loans.
Our 30+ day delinquency metrics include all held for investment loans that are 30 or more days past due, whereas
our 30+ day performing delinquency metrics include loans that are 30 or more days past due and that are also
currently classified as performing and accruing interest. The 30+ day delinquency and 30+ day performing
102