Capital One 2011 Annual Report Download - page 239
Download and view the complete annual report
Please find page 239 of the 2011 Capital One annual report below. You can navigate through the pages in the report by either clicking on the pages listed below, or by using the keyword search tool below to find specific information within the annual report.-
 1
1 -
2
-
3
-
4
-
5
-
6
-
7
-
8
-
9
-
10
-
11
-
12
-
13
-
14
-
15
-
16
-
17
-
18
-
19
-
20
-
21
-
22
-
23
-
24
-
25
-
26
-
27
-
28
-
29
-
30
-
31
-
32
-
33
-
34
-
35
-
36
-
37
-
38
-
39
-
40
-
41
-
42
-
43
-
44
-
45
-
46
-
47
-
48
-
49
-
50
-
51
-
52
-
53
-
54
-
55
-
56
-
57
-
58
-
59
-
60
-
61
-
62
-
63
-
64
-
65
-
66
-
67
-
68
-
69
-
70
-
71
-
72
-
73
-
74
-
75
-
76
-
77
-
78
-
79
-
80
-
81
-
82
-
83
-
84
-
85
-
86
-
87
-
88
-
89
-
90
-
91
-
92
-
93
-
94
-
95
-
96
-
97
-
98
-
99
-
100
-
101
-
102
-
103
-
104
-
105
-
106
-
107
-
108
-
109
-
110
-
111
-
112
-
113
-
114
-
115
-
116
-
117
-
118
-
119
-
120
-
121
-
122
-
123
-
124
-
125
-
126
-
127
-
128
-
129
-
130
-
131
-
132
-
133
-
134
-
135
-
136
-
137
-
138
-
139
-
140
-
141
-
142
-
143
-
144
-
145
-
146
-
147
-
148
-
149
-
150
-
151
-
152
-
153
-
154
-
155
-
156
-
157
-
158
-
159
-
160
-
161
-
162
-
163
-
164
-
165
-
166
-
167
-
168
-
169
-
170
-
171
-
172
-
173
-
174
-
175
-
176
-
177
-
178
-
179
-
180
-
181
-
182
-
183
-
184
-
185
-
186
-
187
-
188
-
189
-
190
-
191
-
192
-
193
-
194
-
195
-
196
-
197
-
198
-
199
-
200
-
201
-
202
-
203
-
204
-
205
-
206
-
207
-
208
-
209
-
210
-
211
-
212
-
213
-
214
-
215
-
216
-
217
-
218
-
219
-
220
-
221
-
222
-
223
-
224
-
225
-
226
-
227
-
228
-
 229
229 -
 230
230 -
 231
231 -
 232
232 -
 233
233 -
 234
234 -
 235
235 -
 236
236 -
 237
237 -
 238
238 -
 239
239 -
 240
240 -
 241
241 -
 242
242 -
 243
243 -
 244
244 -
 245
245 -
 246
246 -
 247
247 -
 248
248 -
 249
249 -
250
-
251
-
252
-
253
-
254
-
255
-
256
-
257
-
258
-
259
-
260
-
261
-
262
-
263
-
264
-
265
-
266
-
267
-
268
-
269
-
270
-
271
-
272
-
273
-
274
-
275
-
276
-
277
-
278
-
279
-
280
-
281
-
282
-
283
-
284
-
285
-
286
-
287
-
288
-
289
-
290
-
291
-
292
-
293
-
294
-
295
-
296
-
297
-
298
 |
 |

CAPITAL ONE FINANCIAL CORPORATION
NOTES TO CONSOLIDATED STATEMENTS—(Continued)
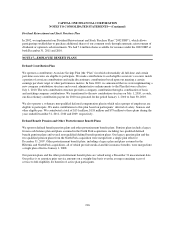
To develop the expected long-term rate of return on plan assets assumption, consideration was given to the
current level of expected returns on risk-free investments (primarily government bonds), the historical level of
the risk premium associated with the other asset classes in which the portfolio is invested and the expectations for
future returns of each asset class. The expected return for each asset class was then weighted based on the target
asset allocation to develop the expected long-term rate of return on the plan assets assumption for the portfolio.
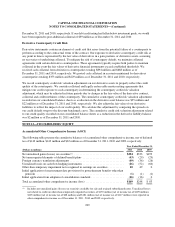
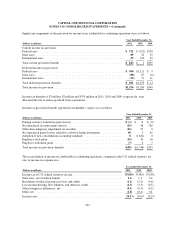
Assumed health care trend rates have a significant effect on the amounts reported for the other postretirement
benefit plans. A one-percentage point change in assumed health care cost trend rates would have the following
effects:
Year ended December 31,
2011 2010
1% Increase 1% Decrease 1% Increase 1% Decrease
Effect on year-end postretirement benefit obligation ...... $7 $(6) $6 $(5)
Effect on total service and interest cost components ...... 0000
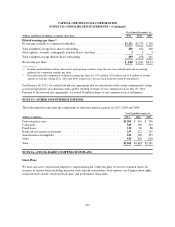
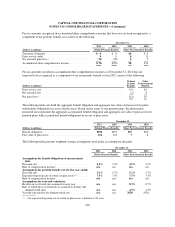
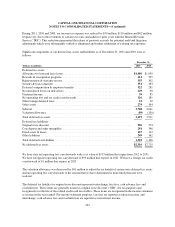
Plan Assets
The qualified defined benefit pension plan asset allocations as of the annual measurement dates are as follows:
December 31,
2011 2010
Common collective trusts(1) ..................................................... 56% 74%
Money market fund ........................................................... 03
Corporate bonds (S&P rating of A or higher) ....................................... 61
Corporate bonds (S&P rating of lower than A) ...................................... 10 2
Government securities ......................................................... 21 20
Mortgage backed securities ..................................................... 70
Municipal bonds .............................................................. 00
Total ....................................................................... 100% 100%
(1) Common collective trusts include domestic and international equity securities.
The investment guidelines provide the following asset allocation targets and ranges: domestic equity target of
50% and allowable range of 45% to 55%, international equity target of 20% and allowable range of 15% to 25%,
and fixed income securities target of 30% and allowable range of 25% to 40%.
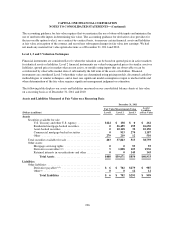
Plan assets are invested using a total return investment approach whereby a mix of equity securities and debt
securities are used to preserve asset values, diversify risk and enhance our ability to achieve our long-term
investment return benchmark. Investment strategies and asset allocations are based on careful consideration of
plan liabilities, the plan’s funded status and our financial condition. Investment performance and asset allocation
are measured and monitored on a quarterly basis.
Plan assets are managed in a balanced portfolio comprised of three major components: a domestic equity portion,
an international equity portion and a domestic fixed income portion. The expected role of plan equity
investments is to maximize the long-term real growth of fund assets, while the role of fixed income investments
is to generate current income, provide for more stable periodic returns and provide some protection against a
prolonged decline in the market value of fund equity investments.
219