Capital One 2011 Annual Report Download - page 87
Download and view the complete annual report
Please find page 87 of the 2011 Capital One annual report below. You can navigate through the pages in the report by either clicking on the pages listed below, or by using the keyword search tool below to find specific information within the annual report.-
 1
1 -
2
-
3
-
4
-
5
-
6
-
7
-
8
-
9
-
10
-
11
-
12
-
13
-
14
-
15
-
16
-
17
-
18
-
19
-
20
-
21
-
22
-
23
-
24
-
25
-
26
-
27
-
28
-
29
-
30
-
31
-
32
-
33
-
34
-
35
-
36
-
37
-
38
-
39
-
40
-
41
-
42
-
43
-
44
-
45
-
46
-
47
-
48
-
49
-
50
-
51
-
52
-
53
-
54
-
55
-
56
-
57
-
58
-
59
-
60
-
61
-
62
-
63
-
64
-
65
-
66
-
67
-
68
-
69
-
70
-
71
-
72
-
73
-
74
-
75
-
76
-
 77
77 -
 78
78 -
 79
79 -
 80
80 -
 81
81 -
 82
82 -
 83
83 -
 84
84 -
 85
85 -
 86
86 -
 87
87 -
 88
88 -
 89
89 -
 90
90 -
 91
91 -
 92
92 -
 93
93 -
 94
94 -
 95
95 -
 96
96 -
 97
97 -
98
-
99
-
100
-
101
-
102
-
103
-
104
-
105
-
106
-
107
-
108
-
109
-
110
-
111
-
112
-
113
-
114
-
115
-
116
-
117
-
118
-
119
-
120
-
121
-
122
-
123
-
124
-
125
-
126
-
127
-
128
-
129
-
130
-
131
-
132
-
133
-
134
-
135
-
136
-
137
-
138
-
139
-
140
-
141
-
142
-
143
-
144
-
145
-
146
-
147
-
148
-
149
-
150
-
151
-
152
-
153
-
154
-
155
-
156
-
157
-
158
-
159
-
160
-
161
-
162
-
163
-
164
-
165
-
166
-
167
-
168
-
169
-
170
-
171
-
172
-
173
-
174
-
175
-
176
-
177
-
178
-
179
-
180
-
181
-
182
-
183
-
184
-
185
-
186
-
187
-
188
-
189
-
190
-
191
-
192
-
193
-
194
-
195
-
196
-
197
-
198
-
199
-
200
-
201
-
202
-
203
-
204
-
205
-
206
-
207
-
208
-
209
-
210
-
211
-
212
-
213
-
214
-
215
-
216
-
217
-
218
-
219
-
220
-
221
-
222
-
223
-
224
-
225
-
226
-
227
-
228
-
229
-
230
-
231
-
232
-
233
-
234
-
235
-
236
-
237
-
238
-
239
-
240
-
241
-
242
-
243
-
244
-
245
-
246
-
247
-
248
-
249
-
250
-
251
-
252
-
253
-
254
-
255
-
256
-
257
-
258
-
259
-
260
-
261
-
262
-
263
-
264
-
265
-
266
-
267
-
268
-
269
-
270
-
271
-
272
-
273
-
274
-
275
-
276
-
277
-
278
-
279
-
280
-
281
-
282
-
283
-
284
-
285
-
286
-
287
-
288
-
289
-
290
-
291
-
292
-
293
-
294
-
295
-
296
-
297
-
298
 |
 |
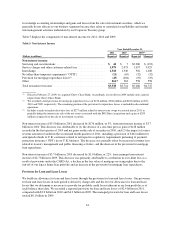
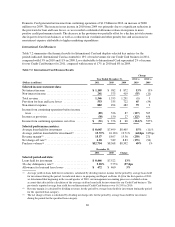
•Provision for Loan and Lease Losses: The provision for loan and lease losses related to our Credit Card
business decreased by $2.9 billion in 2010, to $3.2 billion. The substantial reduction in the provision was
driven by improved credit trends, as evidenced by a reduction in the net charge-off rate and a decrease and
stabilization of delinquency rates throughout the year, as well as lower period-end loan balances. As a result
of the more positive credit performance trends and reduced loan balances, the Credit Card business recorded
a net allowance release (after taking into consideration the $4.2 billion addition to the allowance on
January 1, 2010 from the adoption of the new consolidation accounting standards) of $2.3 billion in 2010. In
comparison, our Credit Card business recorded an allowance release of $611 million in 2009. The release in
2009 was driven by the reduction in period-end loans, which more than offset the impact of the continued
deterioration in the credit performance of our credit card portfolio due to the severe economic downturn.
•Non-Interest Expense: Non-interest expense increased by $212 million, or 6%, in 2010. The increase
reflects the impact of an increase in marketing expenses, which has been partially offset by a decrease in
operating expenses due to the reduction in customer accounts and targeted cost savings across our Credit
Card business. As the economy gradually improved, we increased our marketing expenditures during 2010
from suppressed levels in 2009 to attract and support new business volume through a variety of channels.
•Total Loans: Period-end loans in the Credit Card business declined by $7.2 billion, or 10%, in 2010, to
$61.4 billion as of December 31, 2010, from $68.5 billion as of December 31, 2009. Approximately $3.2
billion of the decrease was due to the run-off of installment loans in our Domestic Card division. The
remaining decrease, which was partially offset by the addition of the Sony Card portfolio, was attributable
to elevated net charge-offs, weak consumer demand and historically lower marketing expenditures in 2009
and 2010 as result of the severe economic downturn.
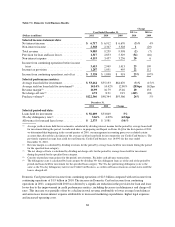
•Charge-off and Delinquency Statistics: Although net charge-off and delinquency rates remained elevated,
these rates continued to improve throughout 2010. The net charge-off rate decreased to 8.79% in 2010, from
9.15% in 2009. The 30+ day delinquency rate decreased to 4.29% as of December 31, 2010, from 5.88% as
of December 31, 2009.
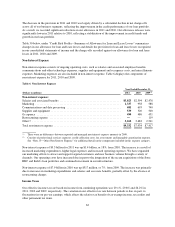
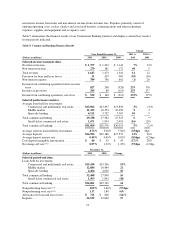
Domestic Card Business
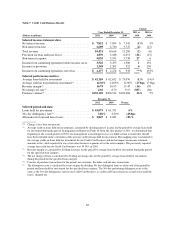
Table 7.1 summarizes the financial results for Domestic Card and displays selected key metrics for the periods
indicated. Domestic Card accounted for 87% of total revenues for our Credit Card business in 2011, compared
with 87% in 2010 and 89% in 2009. Income attributable to Domestic Card represented 102% of income for our
Credit Card business for 2011, compared with 83% in 2010 and 94% in 2009. Because our Domestic Card
business currently accounts for the substantial majority of our Credit Card business, the key factors driving the
results for this division are similar to the key factors affecting our total Credit Card business.
67