Capital One 2011 Annual Report Download - page 146
Download and view the complete annual report
Please find page 146 of the 2011 Capital One annual report below. You can navigate through the pages in the report by either clicking on the pages listed below, or by using the keyword search tool below to find specific information within the annual report.-
 1
1 -
2
-
3
-
4
-
5
-
6
-
7
-
8
-
9
-
10
-
11
-
12
-
13
-
14
-
15
-
16
-
17
-
18
-
19
-
20
-
21
-
22
-
23
-
24
-
25
-
26
-
27
-
28
-
29
-
30
-
31
-
32
-
33
-
34
-
35
-
36
-
37
-
38
-
39
-
40
-
41
-
42
-
43
-
44
-
45
-
46
-
47
-
48
-
49
-
50
-
51
-
52
-
53
-
54
-
55
-
56
-
57
-
58
-
59
-
60
-
61
-
62
-
63
-
64
-
65
-
66
-
67
-
68
-
69
-
70
-
71
-
72
-
73
-
74
-
75
-
76
-
77
-
78
-
79
-
80
-
81
-
82
-
83
-
84
-
85
-
86
-
87
-
88
-
89
-
90
-
91
-
92
-
93
-
94
-
95
-
96
-
97
-
98
-
99
-
100
-
101
-
102
-
103
-
104
-
105
-
106
-
107
-
108
-
109
-
110
-
111
-
112
-
113
-
114
-
115
-
116
-
117
-
118
-
119
-
120
-
121
-
122
-
123
-
124
-
125
-
126
-
127
-
128
-
129
-
130
-
131
-
132
-
133
-
134
-
135
-
 136
136 -
 137
137 -
 138
138 -
 139
139 -
 140
140 -
 141
141 -
 142
142 -
 143
143 -
 144
144 -
 145
145 -
 146
146 -
 147
147 -
 148
148 -
 149
149 -
 150
150 -
 151
151 -
 152
152 -
 153
153 -
 154
154 -
 155
155 -
 156
156 -
157
-
158
-
159
-
160
-
161
-
162
-
163
-
164
-
165
-
166
-
167
-
168
-
169
-
170
-
171
-
172
-
173
-
174
-
175
-
176
-
177
-
178
-
179
-
180
-
181
-
182
-
183
-
184
-
185
-
186
-
187
-
188
-
189
-
190
-
191
-
192
-
193
-
194
-
195
-
196
-
197
-
198
-
199
-
200
-
201
-
202
-
203
-
204
-
205
-
206
-
207
-
208
-
209
-
210
-
211
-
212
-
213
-
214
-
215
-
216
-
217
-
218
-
219
-
220
-
221
-
222
-
223
-
224
-
225
-
226
-
227
-
228
-
229
-
230
-
231
-
232
-
233
-
234
-
235
-
236
-
237
-
238
-
239
-
240
-
241
-
242
-
243
-
244
-
245
-
246
-
247
-
248
-
249
-
250
-
251
-
252
-
253
-
254
-
255
-
256
-
257
-
258
-
259
-
260
-
261
-
262
-
263
-
264
-
265
-
266
-
267
-
268
-
269
-
270
-
271
-
272
-
273
-
274
-
275
-
276
-
277
-
278
-
279
-
280
-
281
-
282
-
283
-
284
-
285
-
286
-
287
-
288
-
289
-
290
-
291
-
292
-
293
-
294
-
295
-
296
-
297
-
298
 |
 |

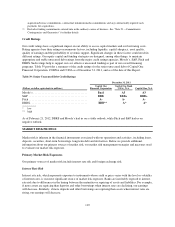
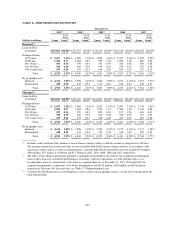
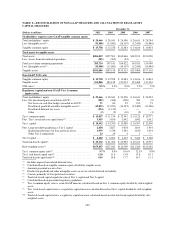
TABLE C—NONPERFORMING ASSETS
December 31,
(Dollars in millions) 2011 2010 2009 2008 2007
Nonperforming loans held for investment:(1)(2)
Consumer Banking business:
Auto ................................................... $ 106 $ 99 $ 143 $ 165 $ 157
Home loan .............................................. 456 486 323 104 98
Retail banking(3) .......................................... 126 145 121 150 58
Total consumer banking business ........................ 688 730 587 419 313
Commercial Banking business:
Commercial and multifamily real estate ....................... 206 276 429 142 29
Middle market ........................................... 92 133 104 39 29
Specialty lending ......................................... 33 48 74 37 6
Total commercial lending .............................. 331 457 607 218 64
Small-ticket commercial real estate ........................... 40 38 95 167 16
Total commercial banking business ....................... 371 495 702 385 80
Total nonperforming loans held for investment .............. 1,059 1,225 1,289 804 393
Other nonperforming assets:
Foreclosed property(4) ..................................... 169 306 234 89 48
Repossessed assets ........................................ 20 20 24 66 57
Total nonperforming assets ............................. $1,248 $1,551 $1,547 $ 959 $ 498
Nonperforming loans as a percentage of loans held for
investment(2) ........................................... 0.78% 0.97% 0.94% 0.80% 0.39%
Nonperforming assets as a percentage of loans held for investment
plus total other nonperforming assets(2) ...................... 0.92% 1.23% 1.13% 0.95% 0.49%
(1) The ratio of nonperforming loans as a percentage of total loans held for investment is calculated based on the
nonperforming loans in each loan category divided by the total outstanding unpaid principal balance of loans held for
investment in each loan category. The denominator used in calculating the nonperforming asset ratios consists of total
loans held for investment and other nonperforming assets.
(2) Our calculation of nonperforming loan and asset ratios includes the impact of loans acquired from Chevy Chase Bank.
However, we do not report loans acquired from Chevy Chase Bank as nonperforming unless they do not perform in
accordance with our expectations as of the purchase date, as we recorded these loans at estimated fair value when we
acquired them. The nonperforming loan ratios, excluding the impact of loans acquired from Chevy Chase Bank, for
commercial and multifamily real estate, middle market, total commercial banking, home loan, retail banking, total
consumer banking, and total nonperforming loans held for investment were 1.35%, 0.75%, 1.11%, 7.22%, 2.21%, 2.03%
and 0.81%, respectively, as of December 31, 2011, compared with 2.11%, 1.30%, 1.69%, 6.67%, 2.16%, 2.30% and
1.02%, respectively, as of December 31, 2010. The nonperforming asset ratio, excluding loans acquired from Chevy
Chase Bank, was 0.95% and 1.29% as of December 31, 2011 and 2010, respectively.
(3) Other loans are included in retail banking for all years presented.
(4) Includes $86 million and $201 million of foreclosed properties related to loans acquired from Chevy Chase Bank, as of
December 31, 2011 and 2010, respectively.
126