Capital One 2011 Annual Report Download - page 198
Download and view the complete annual report
Please find page 198 of the 2011 Capital One annual report below. You can navigate through the pages in the report by either clicking on the pages listed below, or by using the keyword search tool below to find specific information within the annual report.-
 1
1 -
2
-
3
-
4
-
5
-
6
-
7
-
8
-
9
-
10
-
11
-
12
-
13
-
14
-
15
-
16
-
17
-
18
-
19
-
20
-
21
-
22
-
23
-
24
-
25
-
26
-
27
-
28
-
29
-
30
-
31
-
32
-
33
-
34
-
35
-
36
-
37
-
38
-
39
-
40
-
41
-
42
-
43
-
44
-
45
-
46
-
47
-
48
-
49
-
50
-
51
-
52
-
53
-
54
-
55
-
56
-
57
-
58
-
59
-
60
-
61
-
62
-
63
-
64
-
65
-
66
-
67
-
68
-
69
-
70
-
71
-
72
-
73
-
74
-
75
-
76
-
77
-
78
-
79
-
80
-
81
-
82
-
83
-
84
-
85
-
86
-
87
-
88
-
89
-
90
-
91
-
92
-
93
-
94
-
95
-
96
-
97
-
98
-
99
-
100
-
101
-
102
-
103
-
104
-
105
-
106
-
107
-
108
-
109
-
110
-
111
-
112
-
113
-
114
-
115
-
116
-
117
-
118
-
119
-
120
-
121
-
122
-
123
-
124
-
125
-
126
-
127
-
128
-
129
-
130
-
131
-
132
-
133
-
134
-
135
-
136
-
137
-
138
-
139
-
140
-
141
-
142
-
143
-
144
-
145
-
146
-
147
-
148
-
149
-
150
-
151
-
152
-
153
-
154
-
155
-
156
-
157
-
158
-
159
-
160
-
161
-
162
-
163
-
164
-
165
-
166
-
167
-
168
-
169
-
170
-
171
-
172
-
173
-
174
-
175
-
176
-
177
-
178
-
179
-
180
-
181
-
182
-
183
-
184
-
185
-
186
-
187
-
 188
188 -
 189
189 -
 190
190 -
 191
191 -
 192
192 -
 193
193 -
 194
194 -
 195
195 -
 196
196 -
 197
197 -
 198
198 -
 199
199 -
 200
200 -
 201
201 -
 202
202 -
 203
203 -
 204
204 -
 205
205 -
 206
206 -
 207
207 -
 208
208 -
209
-
210
-
211
-
212
-
213
-
214
-
215
-
216
-
217
-
218
-
219
-
220
-
221
-
222
-
223
-
224
-
225
-
226
-
227
-
228
-
229
-
230
-
231
-
232
-
233
-
234
-
235
-
236
-
237
-
238
-
239
-
240
-
241
-
242
-
243
-
244
-
245
-
246
-
247
-
248
-
249
-
250
-
251
-
252
-
253
-
254
-
255
-
256
-
257
-
258
-
259
-
260
-
261
-
262
-
263
-
264
-
265
-
266
-
267
-
268
-
269
-
270
-
271
-
272
-
273
-
274
-
275
-
276
-
277
-
278
-
279
-
280
-
281
-
282
-
283
-
284
-
285
-
286
-
287
-
288
-
289
-
290
-
291
-
292
-
293
-
294
-
295
-
296
-
297
-
298
 |
 |

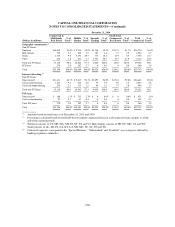
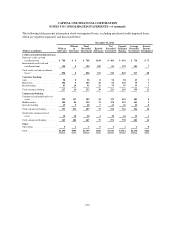
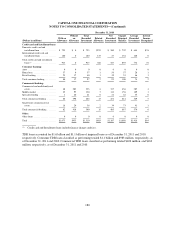
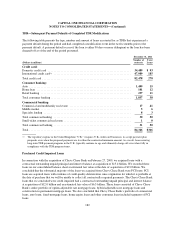
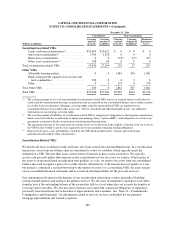
CAPITAL ONE FINANCIAL CORPORATION
NOTES TO CONSOLIDATED STATEMENTS—(Continued)
December 31, 2010
(Dollars in millions)
Commercial &
Multifamily
Real Estate
% of
Total(2)
Middle
Market
% of
Total(2)
Specialty
Lending
% of
Total(2)
Small-ticket
Commercial
Real Estate
% of
Total(2)
Total
Commercial
% of
Total(2)
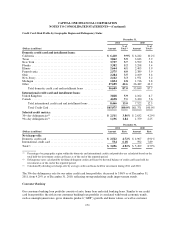
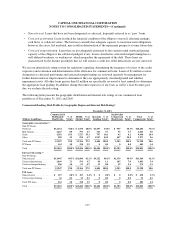
Geographic concentration:(3)
Non-PCI loans:
Northeast .............. $10,849 81.0% $ 3,240 30.9% $1,548 38.5% $1,137 61.7% $16,774 56.4%
Mid-Atlantic . . . . . . . . . . . . 720 5.4 960 9.2 185 4.6 71 3.9 1,936 6.5
South .................. 1,315 9.8 5,191 49.5 733 18.2 119 6.5 7,358 24.7
Other .................. 234 1.8 811 7.7 1,554 38.7 515 27.9 3,114 10.5
Total non-PCI loans ...... 13,118 98.0 10,202 97.3 4,020 100.0 1,842 100.0 29,182 98.1
PCI loans . . . . . . . . . . . . . . 278 2.0 282 2.7 0 0.0 0 0.0 560 1.9
Total .................. $13,396 100.0% $10,484 100.0% $4,020 100.0% $1,842 100.0% $29,742 100.0%
Internal risk rating:(4)
Non-PCI loans:
Noncriticized ........... $11,611 86.7% $ 9,445 90.1% $3,897 96.9% $1,710 92.8% $26,663 89.6%
Criticized performing ..... 1,231 9.2 624 6.0 75 1.9 95 5.2 2,025 6.8
Criticized nonperforming . . 276 2.1 133 1.2 48 1.2 37 2.0 494 1.7
Total non-PCI loans ...... 13,118 98.0 10,202 97.3 4,020 100.0 1,842 100.0 29,182 98.1
PCI loans:
Noncriticized ........... $ 186 1.3% $ 235 2.3% $ 0 0.0% $ 0 0.0% $ 421 1.4%
Criticized performing . . . . . 92 0.7 47 0.4 0 0.0 0 0.0 139 0.5
Total PCI loans . . . . . . . . . . 278 2.0 282 2.7 0 0.0 0 0.0 560 1.9
Total .................. $13,396 100.0% $10,484 100.0% $4,020 100.0% $1,842 100.0% $29,742 100.0%
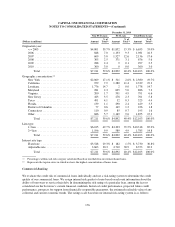
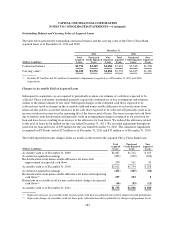
(1) Amounts based on total loans as of December 31, 2011 and 2010.
(2) Percentages calculated based on total held-for-investment commercial loans in each respective loan category as of the
end of the reported period.
(3) Northeast consists of CT, ME, MA, NH, NJ, NY, PA and VT. Mid-Atlantic consists of DE, DC, MD, VA and WV.
South consists of AL, AR, FL, GA, KY, LA, MS, MO, NC, SC, TN and TX.
(4) Criticized exposures correspond to the “Special Mention,” “Substandard” and “Doubtful” asset categories defined by
banking regulatory authorities.
178