Capital One 2011 Annual Report Download - page 201
Download and view the complete annual report
Please find page 201 of the 2011 Capital One annual report below. You can navigate through the pages in the report by either clicking on the pages listed below, or by using the keyword search tool below to find specific information within the annual report.-
 1
1 -
2
-
3
-
4
-
5
-
6
-
7
-
8
-
9
-
10
-
11
-
12
-
13
-
14
-
15
-
16
-
17
-
18
-
19
-
20
-
21
-
22
-
23
-
24
-
25
-
26
-
27
-
28
-
29
-
30
-
31
-
32
-
33
-
34
-
35
-
36
-
37
-
38
-
39
-
40
-
41
-
42
-
43
-
44
-
45
-
46
-
47
-
48
-
49
-
50
-
51
-
52
-
53
-
54
-
55
-
56
-
57
-
58
-
59
-
60
-
61
-
62
-
63
-
64
-
65
-
66
-
67
-
68
-
69
-
70
-
71
-
72
-
73
-
74
-
75
-
76
-
77
-
78
-
79
-
80
-
81
-
82
-
83
-
84
-
85
-
86
-
87
-
88
-
89
-
90
-
91
-
92
-
93
-
94
-
95
-
96
-
97
-
98
-
99
-
100
-
101
-
102
-
103
-
104
-
105
-
106
-
107
-
108
-
109
-
110
-
111
-
112
-
113
-
114
-
115
-
116
-
117
-
118
-
119
-
120
-
121
-
122
-
123
-
124
-
125
-
126
-
127
-
128
-
129
-
130
-
131
-
132
-
133
-
134
-
135
-
136
-
137
-
138
-
139
-
140
-
141
-
142
-
143
-
144
-
145
-
146
-
147
-
148
-
149
-
150
-
151
-
152
-
153
-
154
-
155
-
156
-
157
-
158
-
159
-
160
-
161
-
162
-
163
-
164
-
165
-
166
-
167
-
168
-
169
-
170
-
171
-
172
-
173
-
174
-
175
-
176
-
177
-
178
-
179
-
180
-
181
-
182
-
183
-
184
-
185
-
186
-
187
-
188
-
189
-
190
-
 191
191 -
 192
192 -
 193
193 -
 194
194 -
 195
195 -
 196
196 -
 197
197 -
 198
198 -
 199
199 -
 200
200 -
 201
201 -
 202
202 -
 203
203 -
 204
204 -
 205
205 -
 206
206 -
 207
207 -
 208
208 -
 209
209 -
 210
210 -
 211
211 -
212
-
213
-
214
-
215
-
216
-
217
-
218
-
219
-
220
-
221
-
222
-
223
-
224
-
225
-
226
-
227
-
228
-
229
-
230
-
231
-
232
-
233
-
234
-
235
-
236
-
237
-
238
-
239
-
240
-
241
-
242
-
243
-
244
-
245
-
246
-
247
-
248
-
249
-
250
-
251
-
252
-
253
-
254
-
255
-
256
-
257
-
258
-
259
-
260
-
261
-
262
-
263
-
264
-
265
-
266
-
267
-
268
-
269
-
270
-
271
-
272
-
273
-
274
-
275
-
276
-
277
-
278
-
279
-
280
-
281
-
282
-
283
-
284
-
285
-
286
-
287
-
288
-
289
-
290
-
291
-
292
-
293
-
294
-
295
-
296
-
297
-
298
 |
 |

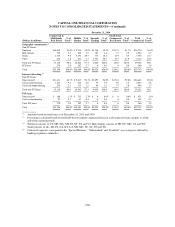
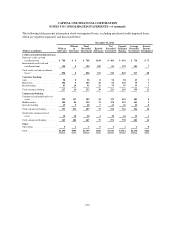
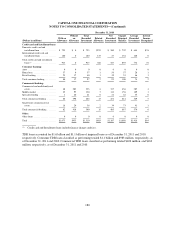
CAPITAL ONE FINANCIAL CORPORATION
NOTES TO CONSOLIDATED STATEMENTS—(Continued)
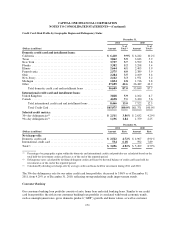
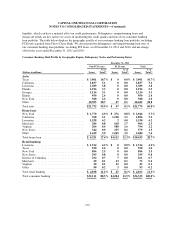
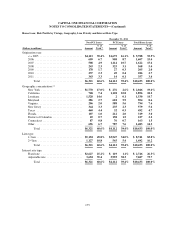
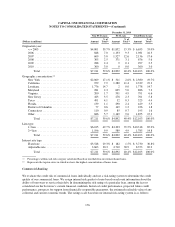
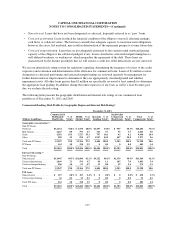
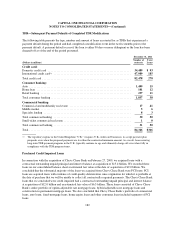
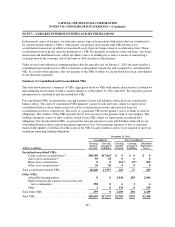
As part of our loan modifications to borrowers experiencing financial difficulty, we may provide multiple
concessions to minimize our economic loss and improve long-term loan performance and collectability. The
following tables present the types, amounts and financial effects of loans modified and accounted for as troubled
debt restructurings during the period:
December 31, 2011
Reduced Interest Rate Term Extension Balance Reduction
(Dollars in millions)
Total
Loans
Modified(1)
% of
TDR
Activity(2)(8)
Average
Rate
Reduction(3)
% of TDR
Activity(4)(8)
Average
Term
Extension
(Months)(5)
% of
TDR
Activity(6)(8)
Gross
Balance
Reduction(7)
Credit card:
Domestic credit card ............ $ 321 100% 10.33% 0% 0 0% $0
International credit card ......... 253 100 23.06 0 0 0 0
Total credit card ............... 574 100 15.93 0 0 0 0
Consumer banking:
Auto ......................... 78 65 1.39 100 10 0 0
Home loan .................... 57 49 2.57 74 95 8 0
Retail banking ................. 77 6 0.73 82 18 0 0
Total consumer banking ......... 212 39 1.75 86 32 2 0
Commercial banking:
Commercial and multifamily real
estate ...................... 166 42 3.13 96 13 11 4
Middle market ................. 140 15 1.25 80 12 1 0
Specialty lending ............... 18 17 0.60 90 22 5 1
Total commercial lending ........ 324 29 2.62 89 14 6 5
Small-ticket commercial real
estate ...................... 4 0 0.00 100 3 0 0
Total commercial banking ........ 328 28 2.62 89 13 6 5
Other:
Other loans ................... 0 0 0.00 0 0 0 0
Total ........................ $1,114 67% 12.70% 43% 21 2% $5
(1) Represents total loans modified and accounted for as a TDR during the period. Paydowns, charge-offs and any other
changes in the loan carrying value subsequent to the loan entering TDR status are not reflected.
(2) Percentage of loans modified and accounted for as a TDR during the period that were granted a reduced interest rate.
(3) Weighted average interest rate reduction for those loans that received an interest rate concession.
(4) Percentage of loans modified and accounted for as a TDR during the period that were granted a maturity date extension.
(5) Weighted average change in maturity date for those loans that received a maturity date extension.
(6) Percentage of loans modified and accounted for as a TDR during the period that were granted forgiveness or forbearance
of a portion of their balance.
(7) Total amount of forgiven or forborne balances.
(8) Due to multiple concessions granted to some troubled borrowers, percentages may total more than 100% for certain loan
types.
181