Capital One 2011 Annual Report Download - page 259
Download and view the complete annual report
Please find page 259 of the 2011 Capital One annual report below. You can navigate through the pages in the report by either clicking on the pages listed below, or by using the keyword search tool below to find specific information within the annual report.-
 1
1 -
2
-
3
-
4
-
5
-
6
-
7
-
8
-
9
-
10
-
11
-
12
-
13
-
14
-
15
-
16
-
17
-
18
-
19
-
20
-
21
-
22
-
23
-
24
-
25
-
26
-
27
-
28
-
29
-
30
-
31
-
32
-
33
-
34
-
35
-
36
-
37
-
38
-
39
-
40
-
41
-
42
-
43
-
44
-
45
-
46
-
47
-
48
-
49
-
50
-
51
-
52
-
53
-
54
-
55
-
56
-
57
-
58
-
59
-
60
-
61
-
62
-
63
-
64
-
65
-
66
-
67
-
68
-
69
-
70
-
71
-
72
-
73
-
74
-
75
-
76
-
77
-
78
-
79
-
80
-
81
-
82
-
83
-
84
-
85
-
86
-
87
-
88
-
89
-
90
-
91
-
92
-
93
-
94
-
95
-
96
-
97
-
98
-
99
-
100
-
101
-
102
-
103
-
104
-
105
-
106
-
107
-
108
-
109
-
110
-
111
-
112
-
113
-
114
-
115
-
116
-
117
-
118
-
119
-
120
-
121
-
122
-
123
-
124
-
125
-
126
-
127
-
128
-
129
-
130
-
131
-
132
-
133
-
134
-
135
-
136
-
137
-
138
-
139
-
140
-
141
-
142
-
143
-
144
-
145
-
146
-
147
-
148
-
149
-
150
-
151
-
152
-
153
-
154
-
155
-
156
-
157
-
158
-
159
-
160
-
161
-
162
-
163
-
164
-
165
-
166
-
167
-
168
-
169
-
170
-
171
-
172
-
173
-
174
-
175
-
176
-
177
-
178
-
179
-
180
-
181
-
182
-
183
-
184
-
185
-
186
-
187
-
188
-
189
-
190
-
191
-
192
-
193
-
194
-
195
-
196
-
197
-
198
-
199
-
200
-
201
-
202
-
203
-
204
-
205
-
206
-
207
-
208
-
209
-
210
-
211
-
212
-
213
-
214
-
215
-
216
-
217
-
218
-
219
-
220
-
221
-
222
-
223
-
224
-
225
-
226
-
227
-
228
-
229
-
230
-
231
-
232
-
233
-
234
-
235
-
236
-
237
-
238
-
239
-
240
-
241
-
242
-
243
-
244
-
245
-
246
-
247
-
248
-
 249
249 -
 250
250 -
 251
251 -
 252
252 -
 253
253 -
 254
254 -
 255
255 -
 256
256 -
 257
257 -
 258
258 -
 259
259 -
 260
260 -
 261
261 -
 262
262 -
 263
263 -
 264
264 -
 265
265 -
 266
266 -
 267
267 -
 268
268 -
 269
269 -
270
-
271
-
272
-
273
-
274
-
275
-
276
-
277
-
278
-
279
-
280
-
281
-
282
-
283
-
284
-
285
-
286
-
287
-
288
-
289
-
290
-
291
-
292
-
293
-
294
-
295
-
296
-
297
-
298
 |
 |

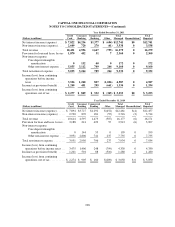
CAPITAL ONE FINANCIAL CORPORATION
NOTES TO CONSOLIDATED STATEMENTS—(Continued)
Year Ended December 31, 2009
(Dollars in millions)
Credit
Card
Consumer
Banking
Commercial
Banking Other
Total
Managed Reconciliation(1)
Total
Reported
Net interest income .............. $ 7,542 $3,231 $1,144 $ 172 $12,089 $(4,392) $ 7,697
Non-interest income ............. 3,747 755 172 73 4,747 539 5,286
Total revenue .................. 11,289 3,986 1,316 245 16,836 (3,853) 12,983
Provision for loan and lease losses 6,051 876 983 173 8,083 (3,853) 4,230
Non-interest expense:
Restructuring expense ........ 0 0 0 119 119 0 119
Core deposit intangible
amortization ............. 0 169 43 0 212 0 212
Other non-interest expense .... 3,738 2,565 618 165 7,086 0 7,086
Total non-interest expense ........ 3,738 2,734 661 284 7,417 0 7,417
Income (loss) from continuing
operations before income taxes . . . 1,500 376 (328) (212) 1,336 0 1,336
Income tax provision (benefit) . . . . . 522 132 (115) (190) 349 0 349
Income (loss) from continuing
operations, net of tax ........... $ 978 $ 244 $ (213) $ (22) $ 987 $ 0 $ 987
(1) Reflects the impact of adjustments to reconcile our total business segment results, which are presented on a managed
basis, to our reported U.S. GAAP results. These adjustments primarily consist of: (i) the reclassification of finance
charges, past due fees, other interest income and interest expense amounts included in non-interest income for
management reporting purposes to net interest income for U.S. GAAP reporting purposes and (ii) the reclassification of
net charge-offs included in non-interest income for management reporting purposes to the provision for loan and lease
losses for U.S. GAAP reporting purposes.
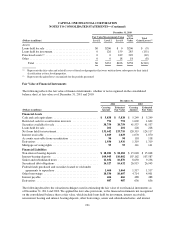
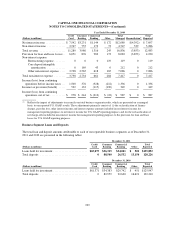
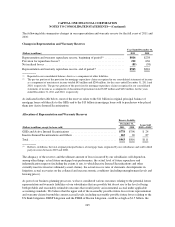
Business Segment Loans and Deposits
The total loan and deposit amounts attributable to each of our reportable business segments as of December 31,
2011 and 2010 are presented in the following tables:
December 31, 2011
(Dollars in millions)
Credit
Card
Consumer
Banking
Commercial
Banking Other
Total
Reported
Loans held for investment ........................ $65,075 $36,315 $34,001 $ 501 $135,892
Total deposits ................................. 0 88,540 26,532 13,154 128,226
December 31, 2010
(Dollars in millions)
Credit
Card
Consumer
Banking
Commercial
Banking Other
Total
Reported
Loans held for investment ........................ $61,371 $34,383 $29,742 $ 451 $125,947
Total deposits ................................. 0 82,959 22,630 16,621 122,210
239
. .