Capital One 2011 Annual Report Download - page 20
Download and view the complete annual report
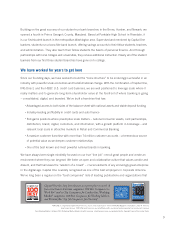
Please find page 20 of the 2011 Capital One annual report below. You can navigate through the pages in the report by either clicking on the pages listed below, or by using the keyword search tool below to find specific information within the annual report.-
 1
1 -
2
-
3
-
4
-
5
-
6
-
7
-
8
-
9
-
 10
10 -
 11
11 -
 12
12 -
 13
13 -
 14
14 -
 15
15 -
 16
16 -
 17
17 -
 18
18 -
 19
19 -
 20
20 -
 21
21 -
 22
22 -
 23
23 -
 24
24 -
 25
25 -
 26
26 -
 27
27 -
 28
28 -
 29
29 -
 30
30 -
31
-
32
-
33
-
34
-
35
-
36
-
37
-
38
-
39
-
40
-
41
-
42
-
43
-
44
-
45
-
46
-
47
-
48
-
49
-
50
-
51
-
52
-
53
-
54
-
55
-
56
-
57
-
58
-
59
-
60
-
61
-
62
-
63
-
64
-
65
-
66
-
67
-
68
-
69
-
70
-
71
-
72
-
73
-
74
-
75
-
76
-
77
-
78
-
79
-
80
-
81
-
82
-
83
-
84
-
85
-
86
-
87
-
88
-
89
-
90
-
91
-
92
-
93
-
94
-
95
-
96
-
97
-
98
-
99
-
100
-
101
-
102
-
103
-
104
-
105
-
106
-
107
-
108
-
109
-
110
-
111
-
112
-
113
-
114
-
115
-
116
-
117
-
118
-
119
-
120
-
121
-
122
-
123
-
124
-
125
-
126
-
127
-
128
-
129
-
130
-
131
-
132
-
133
-
134
-
135
-
136
-
137
-
138
-
139
-
140
-
141
-
142
-
143
-
144
-
145
-
146
-
147
-
148
-
149
-
150
-
151
-
152
-
153
-
154
-
155
-
156
-
157
-
158
-
159
-
160
-
161
-
162
-
163
-
164
-
165
-
166
-
167
-
168
-
169
-
170
-
171
-
172
-
173
-
174
-
175
-
176
-
177
-
178
-
179
-
180
-
181
-
182
-
183
-
184
-
185
-
186
-
187
-
188
-
189
-
190
-
191
-
192
-
193
-
194
-
195
-
196
-
197
-
198
-
199
-
200
-
201
-
202
-
203
-
204
-
205
-
206
-
207
-
208
-
209
-
210
-
211
-
212
-
213
-
214
-
215
-
216
-
217
-
218
-
219
-
220
-
221
-
222
-
223
-
224
-
225
-
226
-
227
-
228
-
229
-
230
-
231
-
232
-
233
-
234
-
235
-
236
-
237
-
238
-
239
-
240
-
241
-
242
-
243
-
244
-
245
-
246
-
247
-
248
-
249
-
250
-
251
-
252
-
253
-
254
-
255
-
256
-
257
-
258
-
259
-
260
-
261
-
262
-
263
-
264
-
265
-
266
-
267
-
268
-
269
-
270
-
271
-
272
-
273
-
274
-
275
-
276
-
277
-
278
-
279
-
280
-
281
-
282
-
283
-
284
-
285
-
286
-
287
-
288
-
289
-
290
-
291
-
292
-
293
-
294
-
295
-
296
-
297
-
298
 |
 |

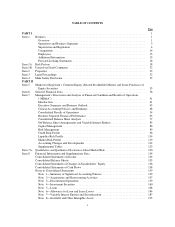
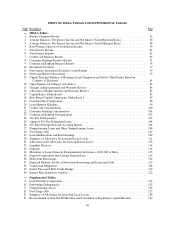
INDEX OF MD&A TABLES AND SUPPLEMENTAL TABLES
Table Description Page
— MD&A Tables:
1 Business Segment Results ........................................................... 42
2 Average Balances, Net Interest Income and Net Interest Yield (Reported Basis) ................. 56
3 Average Balances, Net Interest Income and Net Interest Yield (Managed Basis) ................ 58
4 Rate/Volume Analysis of Net Interest Income ............................................ 59
5 Non-Interest Income ................................................................ 61
6 Non-Interest Expense ............................................................... 62
7 Credit Card Business Results ......................................................... 65
8 Consumer Banking Business Results ................................................... 71
9 Commercial Banking Business Results ................................................. 74
10 Investment Securities ............................................................... 77
11 Non-Agency Investment Securities Credit Ratings ........................................ 79
12 Net Loans Held for Investment ....................................................... 79
13 Unpaid Principal Balance of Mortgage Loans Originated and Sold to Third Parties Based on
Category of Purchaser ............................................................ 81
14 Open Pipeline All Vintages (all entities) ................................................ 82
15 Changes in Representation and Warranty Reserve ........................................ 84
16 Allocation of Representation and Warranty Reserve ....................................... 85
17 Capital Ratios Under Basel I ......................................................... 87
18 Risk-Based Capital Components Under Basel I ........................................... 87
19 Loan Portfolio Composition .......................................................... 98
20 Loan Maturity Schedule ............................................................. 99
21 Credit Card Concentrations .......................................................... 100
22 Consumer Banking Concentrations .................................................... 101
23 Commercial Banking Concentrations .................................................. 102
24 30+ Day Delinquencies ............................................................. 103
25 Aging of 30+ Day Delinquent Loans ................................................... 104
26 90+ Days Delinquent Loans Accruing Interest ........................................... 104
27 Nonperforming Loans and Other Nonperforming Assets ................................... 106
28 Net Charge-Offs ................................................................... 107
29 Loan Modifications and Restructurings ................................................. 109
30 Summary of Allowance for Loan and Lease Losses ....................................... 111
31 Allocation of the Allowance for Loan and Lease Losses .................................... 113
32 Liquidity Reserves ................................................................. 114
33 Deposits ......................................................................... 114
34 Maturities of Large Domestic Denomination Certificates—$100,000 or More .................. 115
35 Deposit Composition and Average Deposit Rates ......................................... 115
36 Short-term Borrowings .............................................................. 116
37 Expected Maturity Profile of Short-term Borrowings and Long-term Debt ..................... 117
38 Contractual Obligations ............................................................. 118
39 Senior Unsecured Debt Credit Ratings ................................................. 119
40 Interest Rate Sensitivity Analysis ...................................................... 122
— Supplemental Tables:
A Loan Portfolio Composition .......................................................... 123
B Performing Delinquencies ........................................................... 125
C Nonperforming Assets .............................................................. 126
D Net Charge-Offs ................................................................... 127
E Summary of Allowance for Loan And Lease Losses ....................................... 128
F Reconciliation of Non-GAAP Measures and Calculation of Regulatory Capital Measures ......... 129
iii