Capital One 2011 Annual Report Download - page 137
Download and view the complete annual report
Please find page 137 of the 2011 Capital One annual report below. You can navigate through the pages in the report by either clicking on the pages listed below, or by using the keyword search tool below to find specific information within the annual report.-
 1
1 -
2
-
3
-
4
-
5
-
6
-
7
-
8
-
9
-
10
-
11
-
12
-
13
-
14
-
15
-
16
-
17
-
18
-
19
-
20
-
21
-
22
-
23
-
24
-
25
-
26
-
27
-
28
-
29
-
30
-
31
-
32
-
33
-
34
-
35
-
36
-
37
-
38
-
39
-
40
-
41
-
42
-
43
-
44
-
45
-
46
-
47
-
48
-
49
-
50
-
51
-
52
-
53
-
54
-
55
-
56
-
57
-
58
-
59
-
60
-
61
-
62
-
63
-
64
-
65
-
66
-
67
-
68
-
69
-
70
-
71
-
72
-
73
-
74
-
75
-
76
-
77
-
78
-
79
-
80
-
81
-
82
-
83
-
84
-
85
-
86
-
87
-
88
-
89
-
90
-
91
-
92
-
93
-
94
-
95
-
96
-
97
-
98
-
99
-
100
-
101
-
102
-
103
-
104
-
105
-
106
-
107
-
108
-
109
-
110
-
111
-
112
-
113
-
114
-
115
-
116
-
117
-
118
-
119
-
120
-
121
-
122
-
123
-
124
-
125
-
126
-
 127
127 -
 128
128 -
 129
129 -
 130
130 -
 131
131 -
 132
132 -
 133
133 -
 134
134 -
 135
135 -
 136
136 -
 137
137 -
 138
138 -
 139
139 -
 140
140 -
 141
141 -
 142
142 -
 143
143 -
 144
144 -
 145
145 -
 146
146 -
 147
147 -
148
-
149
-
150
-
151
-
152
-
153
-
154
-
155
-
156
-
157
-
158
-
159
-
160
-
161
-
162
-
163
-
164
-
165
-
166
-
167
-
168
-
169
-
170
-
171
-
172
-
173
-
174
-
175
-
176
-
177
-
178
-
179
-
180
-
181
-
182
-
183
-
184
-
185
-
186
-
187
-
188
-
189
-
190
-
191
-
192
-
193
-
194
-
195
-
196
-
197
-
198
-
199
-
200
-
201
-
202
-
203
-
204
-
205
-
206
-
207
-
208
-
209
-
210
-
211
-
212
-
213
-
214
-
215
-
216
-
217
-
218
-
219
-
220
-
221
-
222
-
223
-
224
-
225
-
226
-
227
-
228
-
229
-
230
-
231
-
232
-
233
-
234
-
235
-
236
-
237
-
238
-
239
-
240
-
241
-
242
-
243
-
244
-
245
-
246
-
247
-
248
-
249
-
250
-
251
-
252
-
253
-
254
-
255
-
256
-
257
-
258
-
259
-
260
-
261
-
262
-
263
-
264
-
265
-
266
-
267
-
268
-
269
-
270
-
271
-
272
-
273
-
274
-
275
-
276
-
277
-
278
-
279
-
280
-
281
-
282
-
283
-
284
-
285
-
286
-
287
-
288
-
289
-
290
-
291
-
292
-
293
-
294
-
295
-
296
-
297
-
298
 |
 |

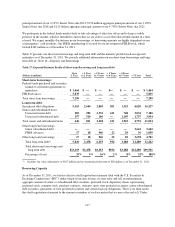
principal amount of our 2.125% Senior Notes due 2014; $750 million aggregate principal amount of our 3.150%
Senior Notes due 2016 and $1.25 billion aggregate principal amount of our 4.750% Senior Notes due 2021.
We participate in the federal funds market daily to take advantage of attractive offers and to keep a visible
presence in the market, which is intended to ensure that we are able to access the federal funds market in a time
of need. We expect monthly fluctuations in our borrowings, as borrowing amounts are highly dependent on our
counterparties’ cash positions. Our FHLB membership is secured by our investment in FHLB stock, which
totaled $362 million as of December 31, 2011.
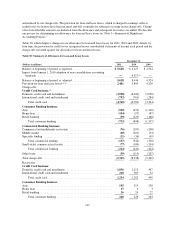
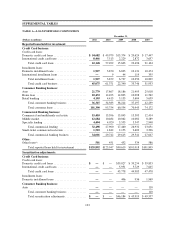
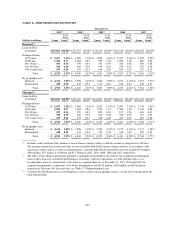
Table 37 presents our short-term borrowings and long-term debt and the maturity profile based on expected
maturities as of December 31, 2011. We provide additional information on our short-term borrowings and long-
term debt in “Note 10—Deposits and Borrowings.”
Table 37: Expected Maturity Profile of Short-term Borrowings and Long-term Debt
(Dollars in millions)
Up to
1 Year
> 1 Year
to 2 Years
> 2 Years
to 3 Years
> 3 Years
to 4 Years
> 4 Years
to 5 Years > 5 Years Total
Short-term borrowings:
Federal funds purchased and securities
loaned or sold under agreements to
repurchase .................... $ 1,464 $ — $ — $— $ — $ — $ 1,464
FHLB advances .................. 5,835 — — — — — 5,835
Total short-term borrowings ........ 7,299 — — — — — 7,299
Long-term debt:
Securitized debt obligations ......... 5,163 2,649 2,869 501 1,325 4,020 16,527
Senior and subordinated notes:
Unsecured senior debt ........... 283 292 2,332 411 748 3,034 7,100
Unsecured subordinated debt ...... 357 519 106 — 1,195 1,757 3,934
Total senior and subordinated notes . . 640 811 2,438 411 1,943 4,791 11,034
Other long-term borrowings:
Junior subordinated debt ......... — — — — — 3,642 3,642
FHLB advances ................ 17 18 946 22 20 36 1,059
Other long-term borrowings ........ 17 18 946 22 20 3,678 4,701
Total long-term debt(1) ........... 5,820 3,478 6,253 934 3,288 12,489 32,262
Total short-term borrowings and
long-term debt ............... $13,119 $3,478 $6,253 $934 $3,288 $12,489 $39,561
Percentage of total .............. 33% 9% 16% 2% 8% 32% 100%
(1) Includes fair value adjustments of $817 million and net unamortized discount of $28 million as of December 31, 2011.
Borrowing Capacity
As of December 31, 2011, we had an effective shelf registration statement filed with the U.S. Securities &
Exchange Commission (“SEC”) under which, from time to time, we may offer and sell an indeterminate
aggregate amount of senior or subordinated debt securities, preferred stock, depository shares representing
preferred stock, common stock, purchase contracts, warrants, units, trust preferred securities, junior subordinated
debt securities, guarantees of trust preferred securities and certain back-up obligations. There is no limit under
this shelf registration statement to the amount or number of such securities that we may offer and sell. Under
117