Capital One 2011 Annual Report Download - page 200
Download and view the complete annual report
Please find page 200 of the 2011 Capital One annual report below. You can navigate through the pages in the report by either clicking on the pages listed below, or by using the keyword search tool below to find specific information within the annual report.-
 1
1 -
2
-
3
-
4
-
5
-
6
-
7
-
8
-
9
-
10
-
11
-
12
-
13
-
14
-
15
-
16
-
17
-
18
-
19
-
20
-
21
-
22
-
23
-
24
-
25
-
26
-
27
-
28
-
29
-
30
-
31
-
32
-
33
-
34
-
35
-
36
-
37
-
38
-
39
-
40
-
41
-
42
-
43
-
44
-
45
-
46
-
47
-
48
-
49
-
50
-
51
-
52
-
53
-
54
-
55
-
56
-
57
-
58
-
59
-
60
-
61
-
62
-
63
-
64
-
65
-
66
-
67
-
68
-
69
-
70
-
71
-
72
-
73
-
74
-
75
-
76
-
77
-
78
-
79
-
80
-
81
-
82
-
83
-
84
-
85
-
86
-
87
-
88
-
89
-
90
-
91
-
92
-
93
-
94
-
95
-
96
-
97
-
98
-
99
-
100
-
101
-
102
-
103
-
104
-
105
-
106
-
107
-
108
-
109
-
110
-
111
-
112
-
113
-
114
-
115
-
116
-
117
-
118
-
119
-
120
-
121
-
122
-
123
-
124
-
125
-
126
-
127
-
128
-
129
-
130
-
131
-
132
-
133
-
134
-
135
-
136
-
137
-
138
-
139
-
140
-
141
-
142
-
143
-
144
-
145
-
146
-
147
-
148
-
149
-
150
-
151
-
152
-
153
-
154
-
155
-
156
-
157
-
158
-
159
-
160
-
161
-
162
-
163
-
164
-
165
-
166
-
167
-
168
-
169
-
170
-
171
-
172
-
173
-
174
-
175
-
176
-
177
-
178
-
179
-
180
-
181
-
182
-
183
-
184
-
185
-
186
-
187
-
188
-
189
-
 190
190 -
 191
191 -
 192
192 -
 193
193 -
 194
194 -
 195
195 -
 196
196 -
 197
197 -
 198
198 -
 199
199 -
 200
200 -
 201
201 -
 202
202 -
 203
203 -
 204
204 -
 205
205 -
 206
206 -
 207
207 -
 208
208 -
 209
209 -
 210
210 -
211
-
212
-
213
-
214
-
215
-
216
-
217
-
218
-
219
-
220
-
221
-
222
-
223
-
224
-
225
-
226
-
227
-
228
-
229
-
230
-
231
-
232
-
233
-
234
-
235
-
236
-
237
-
238
-
239
-
240
-
241
-
242
-
243
-
244
-
245
-
246
-
247
-
248
-
249
-
250
-
251
-
252
-
253
-
254
-
255
-
256
-
257
-
258
-
259
-
260
-
261
-
262
-
263
-
264
-
265
-
266
-
267
-
268
-
269
-
270
-
271
-
272
-
273
-
274
-
275
-
276
-
277
-
278
-
279
-
280
-
281
-
282
-
283
-
284
-
285
-
286
-
287
-
288
-
289
-
290
-
291
-
292
-
293
-
294
-
295
-
296
-
297
-
298
 |
 |

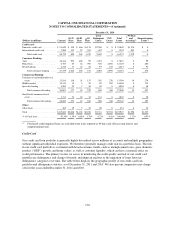
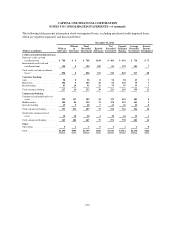
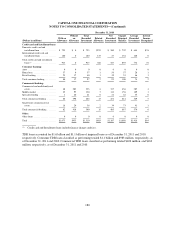
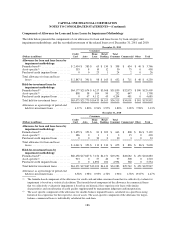
CAPITAL ONE FINANCIAL CORPORATION
NOTES TO CONSOLIDATED STATEMENTS—(Continued)
December 31, 2010
(Dollars in millions)
With an
Allowance
Without
an
Allowance
Total
Recorded
Investment
Related
Allowance
Net
Recorded
Investment
Unpaid
Principal
Balance
Average
Recorded
Investment
Interest
Income
Recognized
Credit card and Installment loans:
Domestic credit card and
installment loan .............. $ 753 $ 0 $ 753 $253 $ 500 $ 739 $ 644 $76
International credit card and
installment loans .............. 160 0 160 133 27 154 128 0
Total credit card and installment
loans(1) ..................... 913 0 913 386 527 893 772 76
Consumer banking:
Auto ......................... 0 0 0 0 0 0 0 0
Home loan .................... 57 0 57 1 56 57 28 1
Retail banking ................. 23 17 40 1 39 51 46 1
Total consumer banking .......... 80 17 97 2 95 108 74 2
Commercial banking:
Commercial and multifamily real
estate ....................... 40 283 323 6 317 436 385 4
Middle market ................. 25 95 120 7 113 156 109 1
Specialty lending ............... 1 20 21 0 21 22 35 0
Total commercial lending . . . . . . . . 66 398 464 13 451 614 529 5
Small-ticket commercial real
estate ....................... 16 20 36 2 34 73 41 1
Total commercial banking . . . . . . . . 82 418 500 15 485 687 570 6
Other:
Other loans .................... 0 0 0 0 0 0 0 0
Total ......................... $1,075 $435 $1,510 $403 $1,107 $1,688 $1,416 $84
(1) Credit card and Installment loans include finance charges and fees.
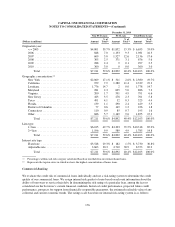
TDR loans accounted for $1.6 billion and $1.1 billion of impaired loans as of December 31, 2011 and 2010,
respectively. Consumer TDR loans classified as performing totaled $1.1 billion and $983 million, respectively, as
of December 31, 2011 and 2010. Commercial TDR loans classified as performing totaled $426 million, and $162
million, respectively, as of December 31, 2011 and 2010.
180