Capital One 2011 Annual Report Download - page 191
Download and view the complete annual report
Please find page 191 of the 2011 Capital One annual report below. You can navigate through the pages in the report by either clicking on the pages listed below, or by using the keyword search tool below to find specific information within the annual report.-
 1
1 -
2
-
3
-
4
-
5
-
6
-
7
-
8
-
9
-
10
-
11
-
12
-
13
-
14
-
15
-
16
-
17
-
18
-
19
-
20
-
21
-
22
-
23
-
24
-
25
-
26
-
27
-
28
-
29
-
30
-
31
-
32
-
33
-
34
-
35
-
36
-
37
-
38
-
39
-
40
-
41
-
42
-
43
-
44
-
45
-
46
-
47
-
48
-
49
-
50
-
51
-
52
-
53
-
54
-
55
-
56
-
57
-
58
-
59
-
60
-
61
-
62
-
63
-
64
-
65
-
66
-
67
-
68
-
69
-
70
-
71
-
72
-
73
-
74
-
75
-
76
-
77
-
78
-
79
-
80
-
81
-
82
-
83
-
84
-
85
-
86
-
87
-
88
-
89
-
90
-
91
-
92
-
93
-
94
-
95
-
96
-
97
-
98
-
99
-
100
-
101
-
102
-
103
-
104
-
105
-
106
-
107
-
108
-
109
-
110
-
111
-
112
-
113
-
114
-
115
-
116
-
117
-
118
-
119
-
120
-
121
-
122
-
123
-
124
-
125
-
126
-
127
-
128
-
129
-
130
-
131
-
132
-
133
-
134
-
135
-
136
-
137
-
138
-
139
-
140
-
141
-
142
-
143
-
144
-
145
-
146
-
147
-
148
-
149
-
150
-
151
-
152
-
153
-
154
-
155
-
156
-
157
-
158
-
159
-
160
-
161
-
162
-
163
-
164
-
165
-
166
-
167
-
168
-
169
-
170
-
171
-
172
-
173
-
174
-
175
-
176
-
177
-
178
-
179
-
180
-
 181
181 -
 182
182 -
 183
183 -
 184
184 -
 185
185 -
 186
186 -
 187
187 -
 188
188 -
 189
189 -
 190
190 -
 191
191 -
 192
192 -
 193
193 -
 194
194 -
 195
195 -
 196
196 -
 197
197 -
 198
198 -
 199
199 -
 200
200 -
 201
201 -
202
-
203
-
204
-
205
-
206
-
207
-
208
-
209
-
210
-
211
-
212
-
213
-
214
-
215
-
216
-
217
-
218
-
219
-
220
-
221
-
222
-
223
-
224
-
225
-
226
-
227
-
228
-
229
-
230
-
231
-
232
-
233
-
234
-
235
-
236
-
237
-
238
-
239
-
240
-
241
-
242
-
243
-
244
-
245
-
246
-
247
-
248
-
249
-
250
-
251
-
252
-
253
-
254
-
255
-
256
-
257
-
258
-
259
-
260
-
261
-
262
-
263
-
264
-
265
-
266
-
267
-
268
-
269
-
270
-
271
-
272
-
273
-
274
-
275
-
276
-
277
-
278
-
279
-
280
-
281
-
282
-
283
-
284
-
285
-
286
-
287
-
288
-
289
-
290
-
291
-
292
-
293
-
294
-
295
-
296
-
297
-
298
 |
 |

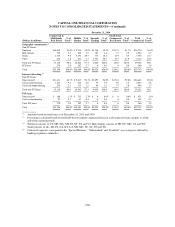
CAPITAL ONE FINANCIAL CORPORATION
NOTES TO CONSOLIDATED STATEMENTS—(Continued)
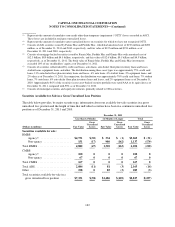
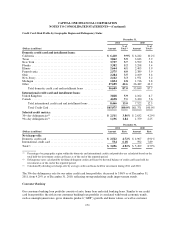
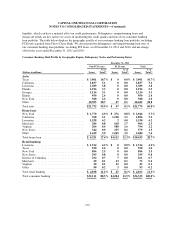
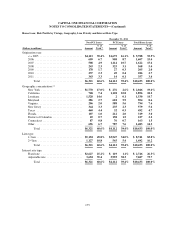
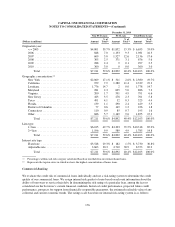
Credit Card: Risk Profile by Geographic Region and Delinquency Status
December 31,
2011 2010
(Dollars in millions) Amount
% of
Total(1) Amount
% of
Total(1)
Domestic credit card and installment loans:
California ................................................ $ 6,410 9.9% $ 6,242 10.2%
Texas ................................................... 3,862 5.9 3,633 5.9
New York ................................................ 3,737 5.7 3,599 5.8
Florida .................................................. 3,382 5.2 3,298 5.4
Illinois .................................................. 2,664 4.1 2,403 3.9
Pennsylvania ............................................. 2,575 4.0 2,389 3.9
Ohio .................................................... 2,284 3.5 2,109 3.4
New Jersey ............................................... 2,162 3.3 1,971 3.2
Michigan ................................................ 1,834 2.8 1,716 2.8
Other ................................................... 27,699 42.6 26,489 43.2
Total domestic credit card and installment loans ............. 56,609 87.0 53,849 87.7
International credit card and installment loans:
United Kingdom .......................................... 3,828 5.9 4,102 6.7
Canada .................................................. 4,638 7.1 3,420 5.6
Total international credit card and installment loans ........... 8,466 13.0 7,522 12.3
Total Credit Card ...................................... $65,075 100.0% $61,371 100.0%
Selected credit metrics:
30+ day delinquencies(2) .................................... $ 2,511 3.86% $ 2,632 4.29%
90+ day delinquencies(2) .................................... 1,196 1.84 1,379 2.25
December 31,
2011 2010
(Dollars in millions) Amount Rate Amount Rate
Net charge-offs:
Domestic credit card ....................................... $ 2,522 4.72% $ 4,907 8.91%
International credit card ..................................... 534 6.18 592 7.89
Total(3) .................................................. $ 3,056 4.92% $ 5,499 8.79%
(1) Percentages by geographic region within the domestic and international credit card portfolios are calculated based on the
total held-for-investment credit card loans as of the end of the reported period.
(2) Delinquency rates calculated by dividing delinquent credit card loans by the total balance of credit card loans held for
investment as of the end of the reported period.
(3) Calculated by dividing net charge-offs by average credit card loans held for investment during 2011 and 2010.
The 30+ day delinquency rate for our entire credit card loan portfolio, decreased to 3.86% as of December 31,
2011, from 4.29% as of December 31, 2010, reflecting strong underlying credit improvement trends.
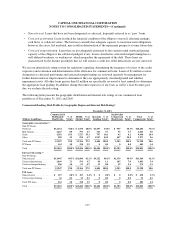
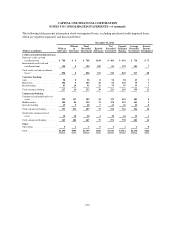
Consumer Banking
Our consumer banking loan portfolio consists of auto, home loan and retail banking loans. Similar to our credit
card loan portfolio, the risk in our consumer banking loan portfolio is correlated with broad economic trends,
such as unemployment rates, gross domestic product (“GDP”) growth, and home values, as well as customer
171