Capital One 2011 Annual Report Download - page 219
Download and view the complete annual report
Please find page 219 of the 2011 Capital One annual report below. You can navigate through the pages in the report by either clicking on the pages listed below, or by using the keyword search tool below to find specific information within the annual report.-
 1
1 -
2
-
3
-
4
-
5
-
6
-
7
-
8
-
9
-
10
-
11
-
12
-
13
-
14
-
15
-
16
-
17
-
18
-
19
-
20
-
21
-
22
-
23
-
24
-
25
-
26
-
27
-
28
-
29
-
30
-
31
-
32
-
33
-
34
-
35
-
36
-
37
-
38
-
39
-
40
-
41
-
42
-
43
-
44
-
45
-
46
-
47
-
48
-
49
-
50
-
51
-
52
-
53
-
54
-
55
-
56
-
57
-
58
-
59
-
60
-
61
-
62
-
63
-
64
-
65
-
66
-
67
-
68
-
69
-
70
-
71
-
72
-
73
-
74
-
75
-
76
-
77
-
78
-
79
-
80
-
81
-
82
-
83
-
84
-
85
-
86
-
87
-
88
-
89
-
90
-
91
-
92
-
93
-
94
-
95
-
96
-
97
-
98
-
99
-
100
-
101
-
102
-
103
-
104
-
105
-
106
-
107
-
108
-
109
-
110
-
111
-
112
-
113
-
114
-
115
-
116
-
117
-
118
-
119
-
120
-
121
-
122
-
123
-
124
-
125
-
126
-
127
-
128
-
129
-
130
-
131
-
132
-
133
-
134
-
135
-
136
-
137
-
138
-
139
-
140
-
141
-
142
-
143
-
144
-
145
-
146
-
147
-
148
-
149
-
150
-
151
-
152
-
153
-
154
-
155
-
156
-
157
-
158
-
159
-
160
-
161
-
162
-
163
-
164
-
165
-
166
-
167
-
168
-
169
-
170
-
171
-
172
-
173
-
174
-
175
-
176
-
177
-
178
-
179
-
180
-
181
-
182
-
183
-
184
-
185
-
186
-
187
-
188
-
189
-
190
-
191
-
192
-
193
-
194
-
195
-
196
-
197
-
198
-
199
-
200
-
201
-
202
-
203
-
204
-
205
-
206
-
207
-
208
-
 209
209 -
 210
210 -
 211
211 -
 212
212 -
 213
213 -
 214
214 -
 215
215 -
 216
216 -
 217
217 -
 218
218 -
 219
219 -
 220
220 -
 221
221 -
 222
222 -
 223
223 -
 224
224 -
 225
225 -
 226
226 -
 227
227 -
 228
228 -
 229
229 -
230
-
231
-
232
-
233
-
234
-
235
-
236
-
237
-
238
-
239
-
240
-
241
-
242
-
243
-
244
-
245
-
246
-
247
-
248
-
249
-
250
-
251
-
252
-
253
-
254
-
255
-
256
-
257
-
258
-
259
-
260
-
261
-
262
-
263
-
264
-
265
-
266
-
267
-
268
-
269
-
270
-
271
-
272
-
273
-
274
-
275
-
276
-
277
-
278
-
279
-
280
-
281
-
282
-
283
-
284
-
285
-
286
-
287
-
288
-
289
-
290
-
291
-
292
-
293
-
294
-
295
-
296
-
297
-
298
 |
 |

CAPITAL ONE FINANCIAL CORPORATION
NOTES TO CONSOLIDATED STATEMENTS—(Continued)
As of December 31, 2011, our mortgage loan servicing portfolio consisted of mortgage loans with an aggregate
unpaid principal balance of $27 billion, of which $18 billion was serviced for other investors. As of
December 31, 2010, our mortgage loan servicing portfolio consisted of mortgage loans with an aggregate unpaid
principal balance of $31 billion, of which $20 billion was serviced for other investors.
NOTE 9—PREMISES, EQUIPMENT & LEASE COMMITMENTS
Premises and Equipment
Premises and equipment are stated at cost less accumulated depreciation and amortization. We capitalize direct
costs (including external costs for purchased software, contractors, consultants and internal staff costs) for
internally developed software projects that have been identified as being in the application development stage.
Depreciation and amortization expenses are computed generally by the straight-line method over the estimated
useful lives of the assets. Useful lives for premises and equipment are as follows:
Premises & Equipment Useful Lives
Buildings and improvement .......................................................... 5-39 years
Furniture and equipment ............................................................ 3-10 years
Computers and software ............................................................. 3-7years
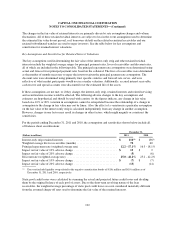
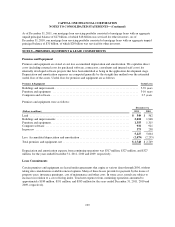
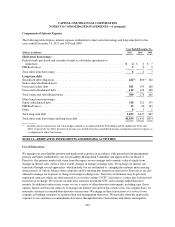
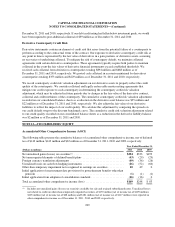
Premises and equipment were as follows:
December 31,
(Dollars in millions) 2011 2010
Land ...................................................................... $ 549 $ 562
Buildings and improvements ................................................... 2,018 1,948
Furniture and equipment ....................................................... 1,355 1,315
Computer software ........................................................... 932 921
In process .................................................................. 373 258
5,227 5,004
Less: Accumulated depreciation and amortization ................................... (2,479) (2,255)
Total premises and equipment, net ............................................... $ 2,748 $ 2,749
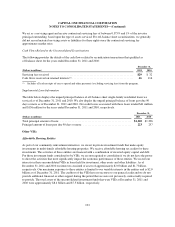
Depreciation and amortization expense from continuing operations was $317 million, $327 million, and $327
million, for the years ended December 31, 2011, 2010 and 2009, respectively.
Lease Commitments
Certain premises and equipment are leased under agreements that expire at various dates through 2056, without
taking into consideration available renewal options. Many of these leases provide for payment by the lessee of
property taxes, insurance premiums, cost of maintenance and other costs. In some cases, rentals are subject to
increases in relation to a cost of living index. Total rent expenses from continuing operations amounted to
approximately $180 million, $191 million, and $183 million for the years ended December 31, 2011, 2010 and
2009, respectively.
199