Capital One 2011 Annual Report Download - page 225
Download and view the complete annual report
Please find page 225 of the 2011 Capital One annual report below. You can navigate through the pages in the report by either clicking on the pages listed below, or by using the keyword search tool below to find specific information within the annual report.-
 1
1 -
2
-
3
-
4
-
5
-
6
-
7
-
8
-
9
-
10
-
11
-
12
-
13
-
14
-
15
-
16
-
17
-
18
-
19
-
20
-
21
-
22
-
23
-
24
-
25
-
26
-
27
-
28
-
29
-
30
-
31
-
32
-
33
-
34
-
35
-
36
-
37
-
38
-
39
-
40
-
41
-
42
-
43
-
44
-
45
-
46
-
47
-
48
-
49
-
50
-
51
-
52
-
53
-
54
-
55
-
56
-
57
-
58
-
59
-
60
-
61
-
62
-
63
-
64
-
65
-
66
-
67
-
68
-
69
-
70
-
71
-
72
-
73
-
74
-
75
-
76
-
77
-
78
-
79
-
80
-
81
-
82
-
83
-
84
-
85
-
86
-
87
-
88
-
89
-
90
-
91
-
92
-
93
-
94
-
95
-
96
-
97
-
98
-
99
-
100
-
101
-
102
-
103
-
104
-
105
-
106
-
107
-
108
-
109
-
110
-
111
-
112
-
113
-
114
-
115
-
116
-
117
-
118
-
119
-
120
-
121
-
122
-
123
-
124
-
125
-
126
-
127
-
128
-
129
-
130
-
131
-
132
-
133
-
134
-
135
-
136
-
137
-
138
-
139
-
140
-
141
-
142
-
143
-
144
-
145
-
146
-
147
-
148
-
149
-
150
-
151
-
152
-
153
-
154
-
155
-
156
-
157
-
158
-
159
-
160
-
161
-
162
-
163
-
164
-
165
-
166
-
167
-
168
-
169
-
170
-
171
-
172
-
173
-
174
-
175
-
176
-
177
-
178
-
179
-
180
-
181
-
182
-
183
-
184
-
185
-
186
-
187
-
188
-
189
-
190
-
191
-
192
-
193
-
194
-
195
-
196
-
197
-
198
-
199
-
200
-
201
-
202
-
203
-
204
-
205
-
206
-
207
-
208
-
209
-
210
-
211
-
212
-
213
-
214
-
 215
215 -
 216
216 -
 217
217 -
 218
218 -
 219
219 -
 220
220 -
 221
221 -
 222
222 -
 223
223 -
 224
224 -
 225
225 -
 226
226 -
 227
227 -
 228
228 -
 229
229 -
 230
230 -
 231
231 -
 232
232 -
 233
233 -
 234
234 -
 235
235 -
236
-
237
-
238
-
239
-
240
-
241
-
242
-
243
-
244
-
245
-
246
-
247
-
248
-
249
-
250
-
251
-
252
-
253
-
254
-
255
-
256
-
257
-
258
-
259
-
260
-
261
-
262
-
263
-
264
-
265
-
266
-
267
-
268
-
269
-
270
-
271
-
272
-
273
-
274
-
275
-
276
-
277
-
278
-
279
-
280
-
281
-
282
-
283
-
284
-
285
-
286
-
287
-
288
-
289
-
290
-
291
-
292
-
293
-
294
-
295
-
296
-
297
-
298
 |
 |

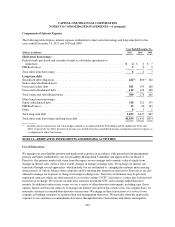
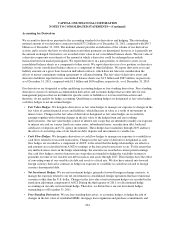
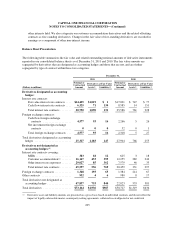
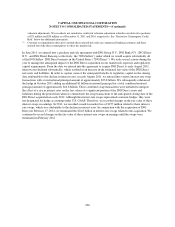
CAPITAL ONE FINANCIAL CORPORATION
NOTES TO CONSOLIDATED STATEMENTS—(Continued)
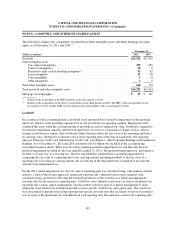
other interests held. We also categorize our customer-accommodation derivatives and the related offsetting
contracts as free-standing derivatives. Changes in the fair value of free-standing derivatives are recorded in
earnings as a component of other non-interest income.
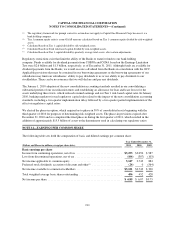
Balance Sheet Presentation
The following table summarizes the fair value and related outstanding notional amounts of derivative instruments
reported in our consolidated balance sheets as of December 31, 2011 and 2010. The fair value amounts are
segregated by derivatives that are designated as accounting hedges and those that are not, and are further
segregated by type of contract within those two categories.
December 31,
2011 2010
Notional or
Contractual
Amount
Derivatives at Fair Value Notional or
Contractual
Amount
Derivatives at Fair Value
(Dollars in millions) Assets(1) Liabilities(1) Assets(1) Liabilities(1)
Derivatives designated as accounting
hedges:
Interest rate contracts:
Fair value interest rate contracts .... $14,425 $1,019 $ 1 $17,001 $ 747 $ 77
Cash flow interest rate contracts .... 6,325 71 130 8,585 14 151
Total interest rate contracts ........ 20,750 1,090 131 25,586 761 228
Foreign exchange contracts:
Cash flow foreign exchange
contracts .................... 4,577 93 16 2,266 5 26
Net investment foreign exchange
contracts .................... 000 52 0 1
Total foreign exchange contracts . . . 4,577 93 16 2,318 5 27
Total derivatives designated as accounting
hedges .......................... 25,327 1,183 147 27,904 766 255
Derivatives not designated as
accounting hedges:(1)
Interest rate contracts covering:
MSRs ......................... 383 18 12 625 3 18
Customer accommodation(2) ....... 16,147 453 395 12,255 282 244
Other interest rate exposures ....... 29,027 85 362 7,579 46 35
Total interest rate contracts ........ 45,557 556 769 20,459 331 297
Foreign exchange contracts ............ 1,348 193 65 1,384 214 67
Other contracts ..................... 932 4 6 980 8 17
Total derivatives not designated as
accounting hedges ................. 47,837 753 840 22,823 553 381
Total derivatives .................... $73,164 $1,936 $987 $50,727 $1,319 $636
(1) Derivative asset and liability amounts are presented on a gross basis based on individual contracts and do not reflect the
impact of legally enforceable master counterparty netting agreements, collateral received/posted or net credit risk
205