Capital One 2011 Annual Report Download - page 205
Download and view the complete annual report
Please find page 205 of the 2011 Capital One annual report below. You can navigate through the pages in the report by either clicking on the pages listed below, or by using the keyword search tool below to find specific information within the annual report.-
 1
1 -
2
-
3
-
4
-
5
-
6
-
7
-
8
-
9
-
10
-
11
-
12
-
13
-
14
-
15
-
16
-
17
-
18
-
19
-
20
-
21
-
22
-
23
-
24
-
25
-
26
-
27
-
28
-
29
-
30
-
31
-
32
-
33
-
34
-
35
-
36
-
37
-
38
-
39
-
40
-
41
-
42
-
43
-
44
-
45
-
46
-
47
-
48
-
49
-
50
-
51
-
52
-
53
-
54
-
55
-
56
-
57
-
58
-
59
-
60
-
61
-
62
-
63
-
64
-
65
-
66
-
67
-
68
-
69
-
70
-
71
-
72
-
73
-
74
-
75
-
76
-
77
-
78
-
79
-
80
-
81
-
82
-
83
-
84
-
85
-
86
-
87
-
88
-
89
-
90
-
91
-
92
-
93
-
94
-
95
-
96
-
97
-
98
-
99
-
100
-
101
-
102
-
103
-
104
-
105
-
106
-
107
-
108
-
109
-
110
-
111
-
112
-
113
-
114
-
115
-
116
-
117
-
118
-
119
-
120
-
121
-
122
-
123
-
124
-
125
-
126
-
127
-
128
-
129
-
130
-
131
-
132
-
133
-
134
-
135
-
136
-
137
-
138
-
139
-
140
-
141
-
142
-
143
-
144
-
145
-
146
-
147
-
148
-
149
-
150
-
151
-
152
-
153
-
154
-
155
-
156
-
157
-
158
-
159
-
160
-
161
-
162
-
163
-
164
-
165
-
166
-
167
-
168
-
169
-
170
-
171
-
172
-
173
-
174
-
175
-
176
-
177
-
178
-
179
-
180
-
181
-
182
-
183
-
184
-
185
-
186
-
187
-
188
-
189
-
190
-
191
-
192
-
193
-
194
-
 195
195 -
 196
196 -
 197
197 -
 198
198 -
 199
199 -
 200
200 -
 201
201 -
 202
202 -
 203
203 -
 204
204 -
 205
205 -
 206
206 -
 207
207 -
 208
208 -
 209
209 -
 210
210 -
 211
211 -
 212
212 -
 213
213 -
 214
214 -
 215
215 -
216
-
217
-
218
-
219
-
220
-
221
-
222
-
223
-
224
-
225
-
226
-
227
-
228
-
229
-
230
-
231
-
232
-
233
-
234
-
235
-
236
-
237
-
238
-
239
-
240
-
241
-
242
-
243
-
244
-
245
-
246
-
247
-
248
-
249
-
250
-
251
-
252
-
253
-
254
-
255
-
256
-
257
-
258
-
259
-
260
-
261
-
262
-
263
-
264
-
265
-
266
-
267
-
268
-
269
-
270
-
271
-
272
-
273
-
274
-
275
-
276
-
277
-
278
-
279
-
280
-
281
-
282
-
283
-
284
-
285
-
286
-
287
-
288
-
289
-
290
-
291
-
292
-
293
-
294
-
295
-
296
-
297
-
298
 |
 |

CAPITAL ONE FINANCIAL CORPORATION
NOTES TO CONSOLIDATED STATEMENTS—(Continued)
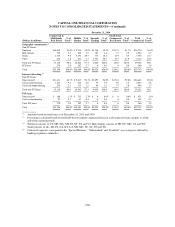
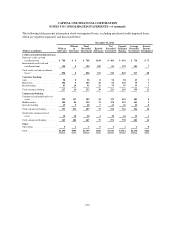
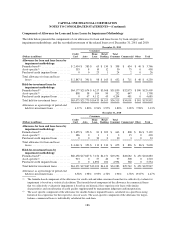
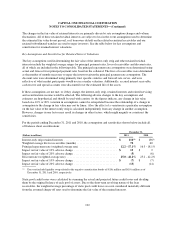
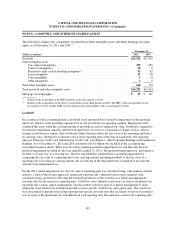
believe have been incurred and will eventually be reflected over time in our charge-offs. Charge-offs of
uncollectible amounts are deducted from the allowance and subsequent recoveries are included. The table below
summarizes changes in the allowance for loan and lease losses, by portfolio segment, for 2011 and 2010:
Consumer Unfunded
Lending
Commitments
Reserve
Combined
Allowance
&
Unfunded
Reserve(Dollars in millions)
Credit
Card Auto
Home
Loan
Retail
Banking
Total
Consumer Commercial Other(1)
Total
Allowance
Balance as of December 31, 2009 . . $ 2,126 $ 665 $ 175 $ 236 $1,076 $ 785 $ 140 $ 4,127 $103 $ 4,230
Impact from January 1, 2010
adoption of new consolidation
accounting standards(2) ........ 4,244 0 73 0 73 0 0 4,317 0 4,317
Balance as of January 1, 2010 ....$6,370 $ 665 $ 248 $ 236 $1,149 $ 785 $ 140 $ 8,444 $103 $ 8,547
Provision for loan and lease
losses ..................... 3,182 145 30 66 241 417 55 3,895 12 3,907
Charge-offs .................. (6,781) (672) (97) (129) (898) (444) (115) (8,238) 0 (8,238)
Recoveries ................... 1,282 215 4 24 243 54 8 1,587 0 1,587
Net charge-offs ............... (5,499) (457) (93) (105) (655) (390) (107) (6,651) 0 (6,651)
Other changes ................ (12) 0 (73) 13 (60) 14 (2) (60) (8) (68)
Balance as of December 31, 2010 . . $ 4,041 $ 353 $ 112 $ 210 $ 675 $ 826 $ 86 $ 5,628 $107 $ 5,735
Provision for loan and lease
losses(3) .................... 1,870 372 63 26 461 62 8 2,401 (41) 2,360
Charge-offs(3) ................. (4,310) (529) (104) (99) (732) (214) (59) (5,315) 0 (5,315)
Recoveries ................... 1,254 195 27 26 248 37 5 1,544 0 1,544
Net charge-offs ............... (3,056) (334) (77) (73) (484) (177) (54) (3,771) 0 (3,771)
Other changes ................ (8) 0 0 0 0 0 0 (8) 0 (8)
Balance as of December 31, 2011 . . $ 2,847 $ 391 $ 98 $ 163 $ 652 $ 711 $ 40 $ 4,250 $ 66 $ 4,316
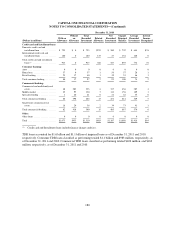
(1) Other consists of our discontinued GreenPoint mortgage operations loan portfolio and our community redevelopment
loan portfolio.
(2) Represents the cumulative effect adjustment on the allowance for loan and lease losses from the January 1, 2010
adoption of the new consolidation accounting standards. Includes an adjustment of $53 million made in the second
quarter of 2010 for the impact as of January 1, 2010 of impairment on consolidated loans accounted for as TDRs. See
“Note 2—Acquisitions and Restructuring Activities.”
(3) The reduction in the provision for loan and lease losses attributable to Kohl’s was $257 million for year ended 2011.
Loss sharing amounts attributable to Kohl’s reduced charge-offs by $118 million during 2011. The expected
reimbursement from Kohl’s netted in our allowance for loan and lease losses was approximately $139 million as of
December 31, 2011.
185