Capital One 2011 Annual Report Download - page 194
Download and view the complete annual report
Please find page 194 of the 2011 Capital One annual report below. You can navigate through the pages in the report by either clicking on the pages listed below, or by using the keyword search tool below to find specific information within the annual report.-
 1
1 -
2
-
3
-
4
-
5
-
6
-
7
-
8
-
9
-
10
-
11
-
12
-
13
-
14
-
15
-
16
-
17
-
18
-
19
-
20
-
21
-
22
-
23
-
24
-
25
-
26
-
27
-
28
-
29
-
30
-
31
-
32
-
33
-
34
-
35
-
36
-
37
-
38
-
39
-
40
-
41
-
42
-
43
-
44
-
45
-
46
-
47
-
48
-
49
-
50
-
51
-
52
-
53
-
54
-
55
-
56
-
57
-
58
-
59
-
60
-
61
-
62
-
63
-
64
-
65
-
66
-
67
-
68
-
69
-
70
-
71
-
72
-
73
-
74
-
75
-
76
-
77
-
78
-
79
-
80
-
81
-
82
-
83
-
84
-
85
-
86
-
87
-
88
-
89
-
90
-
91
-
92
-
93
-
94
-
95
-
96
-
97
-
98
-
99
-
100
-
101
-
102
-
103
-
104
-
105
-
106
-
107
-
108
-
109
-
110
-
111
-
112
-
113
-
114
-
115
-
116
-
117
-
118
-
119
-
120
-
121
-
122
-
123
-
124
-
125
-
126
-
127
-
128
-
129
-
130
-
131
-
132
-
133
-
134
-
135
-
136
-
137
-
138
-
139
-
140
-
141
-
142
-
143
-
144
-
145
-
146
-
147
-
148
-
149
-
150
-
151
-
152
-
153
-
154
-
155
-
156
-
157
-
158
-
159
-
160
-
161
-
162
-
163
-
164
-
165
-
166
-
167
-
168
-
169
-
170
-
171
-
172
-
173
-
174
-
175
-
176
-
177
-
178
-
179
-
180
-
181
-
182
-
183
-
 184
184 -
 185
185 -
 186
186 -
 187
187 -
 188
188 -
 189
189 -
 190
190 -
 191
191 -
 192
192 -
 193
193 -
 194
194 -
 195
195 -
 196
196 -
 197
197 -
 198
198 -
 199
199 -
 200
200 -
 201
201 -
 202
202 -
 203
203 -
 204
204 -
205
-
206
-
207
-
208
-
209
-
210
-
211
-
212
-
213
-
214
-
215
-
216
-
217
-
218
-
219
-
220
-
221
-
222
-
223
-
224
-
225
-
226
-
227
-
228
-
229
-
230
-
231
-
232
-
233
-
234
-
235
-
236
-
237
-
238
-
239
-
240
-
241
-
242
-
243
-
244
-
245
-
246
-
247
-
248
-
249
-
250
-
251
-
252
-
253
-
254
-
255
-
256
-
257
-
258
-
259
-
260
-
261
-
262
-
263
-
264
-
265
-
266
-
267
-
268
-
269
-
270
-
271
-
272
-
273
-
274
-
275
-
276
-
277
-
278
-
279
-
280
-
281
-
282
-
283
-
284
-
285
-
286
-
287
-
288
-
289
-
290
-
291
-
292
-
293
-
294
-
295
-
296
-
297
-
298
 |
 |

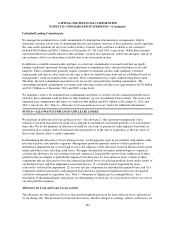
CAPITAL ONE FINANCIAL CORPORATION
NOTES TO CONSOLIDATED STATEMENTS—(Continued)
December 31, 2010
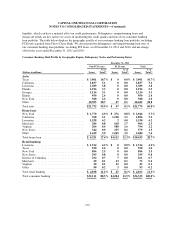
Auto Home Loan Retail Banking
Total Consumer
Banking
(Dollars in millions) Amount Rate Amount Rate Amount Rate Amount Rate
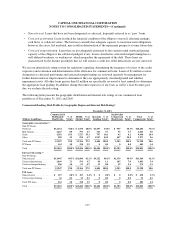
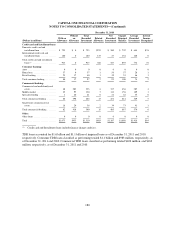
Credit performance:(2)
30+ day delinquencies .................. $1,453 8.13% $504 4.16% $93 2.11% $2,050 5.96%
90+ day delinquencies .................. 99 0.55 395 3.27 40 0.91 534 1.54
Nonperforming loans .................. 99 0.55 486 4.01 91 2.07 676 1.97
December 31, 2011
Auto Home Loan Retail Banking
Total Consumer
Banking
(Dollars in millions) Amount Rate Amount Rate Amount Rate Amount Rate
Net charge-offs(3) ..................... $334 1.72% $77 0.68% $73 1.78% $484 1.39%
December 31, 2010
Auto Home Loan Retail Banking
Total Consumer
Banking
(Dollars in millions) Amount Rate Amount Rate Amount Rate Amount Rate
Net charge-offs(3) ..................... $457 2.61% $93 0.68% $105 2.20% $655 1.82%
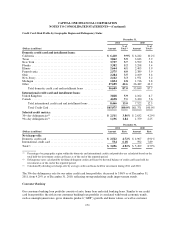
(1) Percentages by geographic region are calculated based on the total held-for-investment consumer banking loans as of the
end of the reported period.
(2) Credit performance statistics exclude PCI loans, which were recorded at fair value at acquisition. Although PCI loans
may be contractually delinquent, we separately track these loans and do not include them in our delinquency and
nonperforming loan statistics as the fair value recorded at acquisition included an estimate of credit losses expected to be
realized over the remaining lives of the loans.
(3) Calculated by dividing net charge-offs by average loans held for investment during 2011 and 2010.
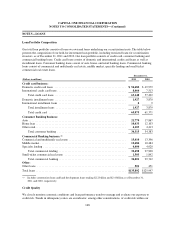
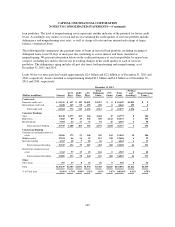
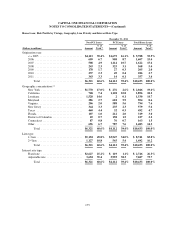
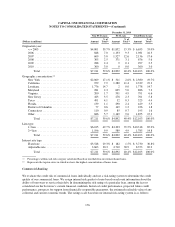
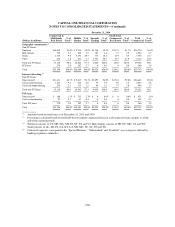
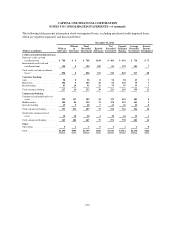
Home Loan
Our home loan portfolio consists of both first-lien and second-lien residential mortgage loans. In evaluating the
credit quality and risk of our home loan portfolio, we continually monitor a variety of mortgage loan
characteristics that may affect the default experience on our overall home loan portfolio, such as vintage,
geographic concentrations, lien priority and product type. Certain loan concentrations have experienced higher
delinquency rates as a result of the significant decline in home prices since the home price peak in 2006 and rise
in unemployment. These loan concentrations include loans originated during 2008, 2007 and 2006 in an
environment of decreasing home sales, broadly declining home prices and more relaxed underwriting standards
and loans on properties in Arizona, California, Florida and Nevada, which have experienced the most severe
decline in home prices. The following table presents the distribution of our home loan portfolio as of
December 31, 2011 and 2010, based on selected key risk characteristics.
174