Capital One 2011 Annual Report Download - page 62
Download and view the complete annual report
Please find page 62 of the 2011 Capital One annual report below. You can navigate through the pages in the report by either clicking on the pages listed below, or by using the keyword search tool below to find specific information within the annual report.-
 1
1 -
2
-
3
-
4
-
5
-
6
-
7
-
8
-
9
-
10
-
11
-
12
-
13
-
14
-
15
-
16
-
17
-
18
-
19
-
20
-
21
-
22
-
23
-
24
-
25
-
26
-
27
-
28
-
29
-
30
-
31
-
32
-
33
-
34
-
35
-
36
-
37
-
38
-
39
-
40
-
41
-
42
-
43
-
44
-
45
-
46
-
47
-
48
-
49
-
50
-
51
-
 52
52 -
 53
53 -
 54
54 -
 55
55 -
 56
56 -
 57
57 -
 58
58 -
 59
59 -
 60
60 -
 61
61 -
 62
62 -
 63
63 -
 64
64 -
 65
65 -
 66
66 -
 67
67 -
 68
68 -
 69
69 -
 70
70 -
 71
71 -
 72
72 -
73
-
74
-
75
-
76
-
77
-
78
-
79
-
80
-
81
-
82
-
83
-
84
-
85
-
86
-
87
-
88
-
89
-
90
-
91
-
92
-
93
-
94
-
95
-
96
-
97
-
98
-
99
-
100
-
101
-
102
-
103
-
104
-
105
-
106
-
107
-
108
-
109
-
110
-
111
-
112
-
113
-
114
-
115
-
116
-
117
-
118
-
119
-
120
-
121
-
122
-
123
-
124
-
125
-
126
-
127
-
128
-
129
-
130
-
131
-
132
-
133
-
134
-
135
-
136
-
137
-
138
-
139
-
140
-
141
-
142
-
143
-
144
-
145
-
146
-
147
-
148
-
149
-
150
-
151
-
152
-
153
-
154
-
155
-
156
-
157
-
158
-
159
-
160
-
161
-
162
-
163
-
164
-
165
-
166
-
167
-
168
-
169
-
170
-
171
-
172
-
173
-
174
-
175
-
176
-
177
-
178
-
179
-
180
-
181
-
182
-
183
-
184
-
185
-
186
-
187
-
188
-
189
-
190
-
191
-
192
-
193
-
194
-
195
-
196
-
197
-
198
-
199
-
200
-
201
-
202
-
203
-
204
-
205
-
206
-
207
-
208
-
209
-
210
-
211
-
212
-
213
-
214
-
215
-
216
-
217
-
218
-
219
-
220
-
221
-
222
-
223
-
224
-
225
-
226
-
227
-
228
-
229
-
230
-
231
-
232
-
233
-
234
-
235
-
236
-
237
-
238
-
239
-
240
-
241
-
242
-
243
-
244
-
245
-
246
-
247
-
248
-
249
-
250
-
251
-
252
-
253
-
254
-
255
-
256
-
257
-
258
-
259
-
260
-
261
-
262
-
263
-
264
-
265
-
266
-
267
-
268
-
269
-
270
-
271
-
272
-
273
-
274
-
275
-
276
-
277
-
278
-
279
-
280
-
281
-
282
-
283
-
284
-
285
-
286
-
287
-
288
-
289
-
290
-
291
-
292
-
293
-
294
-
295
-
296
-
297
-
298
 |
 |

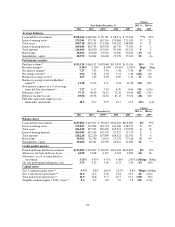
Table 1: Business Segment Results
Year Ended December 31,
2011 2010 2009
Total
Revenue(1)
Net Income
(Loss)(2)
Total
Revenue(1)
Net Income
(Loss)(2)
Total
Revenue(1)
Net Income
(Loss)(2)
(Dollars in millions) Amount
% of
Total Amount
% of
Total Amount
% of
Total Amount
% of
Total Amount
% of
Total Amount
% of
Total
Credit Card ...........$10,431 64% $2,277 70%$10,614 66% $2,274 75% $11,289 67% $ 978 99%
Consumer Banking ..... 4,956 31 809 25 4,597 28 905 30 3,986 24 244 25
Commercial Banking . . . 1,647 10 532 16 1,473 9 160 5 1,316 8 (213) (22)
Other(3) .............. (755) (5) (365) (11) (507) (3) (289) (10) 245 1 (22) (2)
Total from continuing
operations ..........$16,279 100% $3,253 100%$16,177 100% $3,050 100% $16,836 100% $ 987 100%
(1) Total revenue consists of net interest income and non-interest income. Total revenue displayed for 2009 is based on our
non-GAAP managed basis results. For a reconciliation of this non-GAAP measure to the comparable U.S. GAAP
measure, see Exhibit 99.1.
(2) Net income (loss) for our business segments is based on income from continuing operations, net of tax.
(3) Includes the residual impact of the allocation of our centralized Corporate Treasury group activities, such as management
of our corporate investment portfolio and asset/liability management, to our business segments as well as other items as
described in “Note 20—Business Segments.”
42