Capital One 2011 Annual Report Download - page 238
Download and view the complete annual report
Please find page 238 of the 2011 Capital One annual report below. You can navigate through the pages in the report by either clicking on the pages listed below, or by using the keyword search tool below to find specific information within the annual report.-
 1
1 -
2
-
3
-
4
-
5
-
6
-
7
-
8
-
9
-
10
-
11
-
12
-
13
-
14
-
15
-
16
-
17
-
18
-
19
-
20
-
21
-
22
-
23
-
24
-
25
-
26
-
27
-
28
-
29
-
30
-
31
-
32
-
33
-
34
-
35
-
36
-
37
-
38
-
39
-
40
-
41
-
42
-
43
-
44
-
45
-
46
-
47
-
48
-
49
-
50
-
51
-
52
-
53
-
54
-
55
-
56
-
57
-
58
-
59
-
60
-
61
-
62
-
63
-
64
-
65
-
66
-
67
-
68
-
69
-
70
-
71
-
72
-
73
-
74
-
75
-
76
-
77
-
78
-
79
-
80
-
81
-
82
-
83
-
84
-
85
-
86
-
87
-
88
-
89
-
90
-
91
-
92
-
93
-
94
-
95
-
96
-
97
-
98
-
99
-
100
-
101
-
102
-
103
-
104
-
105
-
106
-
107
-
108
-
109
-
110
-
111
-
112
-
113
-
114
-
115
-
116
-
117
-
118
-
119
-
120
-
121
-
122
-
123
-
124
-
125
-
126
-
127
-
128
-
129
-
130
-
131
-
132
-
133
-
134
-
135
-
136
-
137
-
138
-
139
-
140
-
141
-
142
-
143
-
144
-
145
-
146
-
147
-
148
-
149
-
150
-
151
-
152
-
153
-
154
-
155
-
156
-
157
-
158
-
159
-
160
-
161
-
162
-
163
-
164
-
165
-
166
-
167
-
168
-
169
-
170
-
171
-
172
-
173
-
174
-
175
-
176
-
177
-
178
-
179
-
180
-
181
-
182
-
183
-
184
-
185
-
186
-
187
-
188
-
189
-
190
-
191
-
192
-
193
-
194
-
195
-
196
-
197
-
198
-
199
-
200
-
201
-
202
-
203
-
204
-
205
-
206
-
207
-
208
-
209
-
210
-
211
-
212
-
213
-
214
-
215
-
216
-
217
-
218
-
219
-
220
-
221
-
222
-
223
-
224
-
225
-
226
-
227
-
 228
228 -
 229
229 -
 230
230 -
 231
231 -
 232
232 -
 233
233 -
 234
234 -
 235
235 -
 236
236 -
 237
237 -
 238
238 -
 239
239 -
 240
240 -
 241
241 -
 242
242 -
 243
243 -
 244
244 -
 245
245 -
 246
246 -
 247
247 -
 248
248 -
249
-
250
-
251
-
252
-
253
-
254
-
255
-
256
-
257
-
258
-
259
-
260
-
261
-
262
-
263
-
264
-
265
-
266
-
267
-
268
-
269
-
270
-
271
-
272
-
273
-
274
-
275
-
276
-
277
-
278
-
279
-
280
-
281
-
282
-
283
-
284
-
285
-
286
-
287
-
288
-
289
-
290
-
291
-
292
-
293
-
294
-
295
-
296
-
297
-
298
 |
 |

CAPITAL ONE FINANCIAL CORPORATION
NOTES TO CONSOLIDATED STATEMENTS—(Continued)
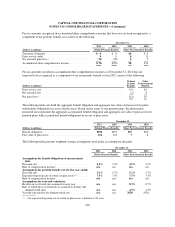
Pre-tax amounts recognized in accumulated other comprehensive income that have not yet been recognized as a
component of net periodic benefit cost consist of the following:
December 31,
2011 2010 2011 2010
(Dollars in millions) Defined Pension Benefits Other Postretirement Benefits
Transition obligation ................................ $0 $0 $0 $0
Prior service credit .................................. 00811
Net actuarial gain (loss) .............................. (74) (58) 02
Accumulated other comprehensive income ............... $(74) $(58) $8 $13
Pre-tax amounts recorded in accumulated other comprehensive income as of December 31, 2011 that are
expected to be recognized as a component of our net periodic benefit cost in 2012 consist of the following:
(Dollars in millions)
Defined
Pension
Benefits
Other
Postretirement
Benefits
Prior service cost ............................................................ $0 $3
Net actuarial loss ............................................................ (2) 0
Net gain (loss) ............................................................... $(2) $3
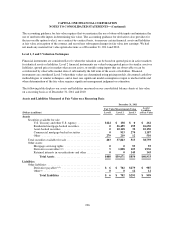
The following table sets forth the aggregate benefit obligation and aggregate fair value of plan assets for plans
with benefit obligations in excess of plan assets. Based on the status of our pension plans, the information
presented also represents the aggregate accumulated benefit obligation and aggregate fair value of plan assets for
pension plans with accumulated benefit obligations in excess of plan assets.
December 31,
2011 2010 2011 2010
(Dollars in millions) Defined Pension Benefits Other Postretirement Benefits
Benefit obligation ................................... $198 $193 $67 $66
Fair value of plan assets .............................. 214 221 78
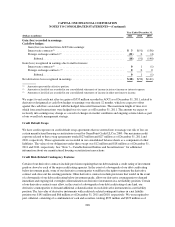
The following table presents weighted-average assumptions used in the accounting for the plans:
December 31,
2011 2010 2011 2010
Defined Pension Benefits Other Postretirement Benefits
Assumptions for benefit obligations at measurement
date:
Discount rate ...................................... 4.5% 5.2% 4.5% 5.2%
Rate of compensation increase ........................ n/a n/a n/a n/a
Assumptions for periodic benefit cost for the year ended:
Discount rate ...................................... 5.2% 5.7% 5.2% 5.7%
Expected long-term rate of return on plan assets(1) ......... 7.3% 7.5% 7.3% 7.5%
Rate of compensation increase ........................ n/a n/a n/a n/a
Assumptions for year-end valuations:
Health care cost trend rate assumed for next year ......... n/a n/a 8.3% 8.7%
Rate to which the cost trend rate is assumed to decline (the
ultimate trend rate) ............................... n/a n/a 4.5% 4.5%
Year the rate reaches the ultimate trend rate ............. n/a n/a 2028 2028
(1) Our expected long-term rate of return on plan assets is defined as 20 years.
218