Capital One 2011 Annual Report Download - page 104
Download and view the complete annual report
Please find page 104 of the 2011 Capital One annual report below. You can navigate through the pages in the report by either clicking on the pages listed below, or by using the keyword search tool below to find specific information within the annual report.-
 1
1 -
2
-
3
-
4
-
5
-
6
-
7
-
8
-
9
-
10
-
11
-
12
-
13
-
14
-
15
-
16
-
17
-
18
-
19
-
20
-
21
-
22
-
23
-
24
-
25
-
26
-
27
-
28
-
29
-
30
-
31
-
32
-
33
-
34
-
35
-
36
-
37
-
38
-
39
-
40
-
41
-
42
-
43
-
44
-
45
-
46
-
47
-
48
-
49
-
50
-
51
-
52
-
53
-
54
-
55
-
56
-
57
-
58
-
59
-
60
-
61
-
62
-
63
-
64
-
65
-
66
-
67
-
68
-
69
-
70
-
71
-
72
-
73
-
74
-
75
-
76
-
77
-
78
-
79
-
80
-
81
-
82
-
83
-
84
-
85
-
86
-
87
-
88
-
89
-
90
-
91
-
92
-
93
-
 94
94 -
 95
95 -
 96
96 -
 97
97 -
 98
98 -
 99
99 -
 100
100 -
 101
101 -
 102
102 -
 103
103 -
 104
104 -
 105
105 -
 106
106 -
 107
107 -
 108
108 -
 109
109 -
 110
110 -
 111
111 -
 112
112 -
 113
113 -
 114
114 -
115
-
116
-
117
-
118
-
119
-
120
-
121
-
122
-
123
-
124
-
125
-
126
-
127
-
128
-
129
-
130
-
131
-
132
-
133
-
134
-
135
-
136
-
137
-
138
-
139
-
140
-
141
-
142
-
143
-
144
-
145
-
146
-
147
-
148
-
149
-
150
-
151
-
152
-
153
-
154
-
155
-
156
-
157
-
158
-
159
-
160
-
161
-
162
-
163
-
164
-
165
-
166
-
167
-
168
-
169
-
170
-
171
-
172
-
173
-
174
-
175
-
176
-
177
-
178
-
179
-
180
-
181
-
182
-
183
-
184
-
185
-
186
-
187
-
188
-
189
-
190
-
191
-
192
-
193
-
194
-
195
-
196
-
197
-
198
-
199
-
200
-
201
-
202
-
203
-
204
-
205
-
206
-
207
-
208
-
209
-
210
-
211
-
212
-
213
-
214
-
215
-
216
-
217
-
218
-
219
-
220
-
221
-
222
-
223
-
224
-
225
-
226
-
227
-
228
-
229
-
230
-
231
-
232
-
233
-
234
-
235
-
236
-
237
-
238
-
239
-
240
-
241
-
242
-
243
-
244
-
245
-
246
-
247
-
248
-
249
-
250
-
251
-
252
-
253
-
254
-
255
-
256
-
257
-
258
-
259
-
260
-
261
-
262
-
263
-
264
-
265
-
266
-
267
-
268
-
269
-
270
-
271
-
272
-
273
-
274
-
275
-
276
-
277
-
278
-
279
-
280
-
281
-
282
-
283
-
284
-
285
-
286
-
287
-
288
-
289
-
290
-
291
-
292
-
293
-
294
-
295
-
296
-
297
-
298
 |
 |

current and future losses inherent within the securitization and apply legal judgment to the anticipated factual and
legal record to estimate the lifetime legal liability for each securitization. Our estimated legal liability for each
securitization within this category assumes that we will be responsible for only a portion of the losses inherent in
each securitization. Our litigation reserves with respect to both the U.S. Bank Litigation and the DBSP Litigation,
in each case as referenced below, are contained within the Active Insured Securitization reserve category.
Further, our litigation reserves with respect to indemnification risks from certain representation and warranty
lawsuits brought by monoline bond insurers against third-party securitizations sponsors, where GreenPoint
provided some or all of the mortgage collateral within the securitization but is not a defendant in the litigation,
are also contained within this category.
For the $6 billion original principal balance of mortgage loans in the Inactive Insured Securitizations category
and the $81 billion original principal balance of mortgage loans in the Uninsured Securitizations and other whole
loan sales categories, we establish reserves by relying on our historical activity and repurchase rates to estimate
repurchase liabilities over the next twelve (12) months. We do not believe we can estimate repurchase liability
for these categories for a period longer than twelve (12) months because of the relatively irregular nature of
repurchase activity within these categories. Some Uninsured Securitization investors from this category who
have not made repurchase requests or filed representation and warranty lawsuits are currently suing investment
banks and securitization sponsors under federal and/or state securities laws. Although we face some direct and
indirect indemnity risks from these litigations, we have not established reserves with respect to these indemnity
risks because we do not consider them to be both probable and reasonably estimable liabilities.
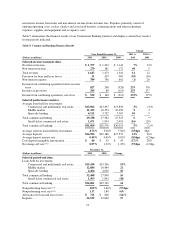
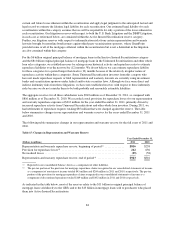
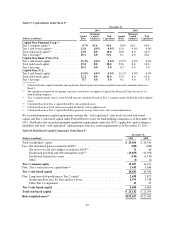
The aggregate reserves for all three subsidiaries were $943 million as of December 31, 2011, as compared with
$816 million as of December 31, 2010. We recorded a total provision for repurchase losses for our representation
and warranty repurchase exposure of $212 million for the year ended December 31, 2011, primarily driven by
increased repurchase activity from Uninsured Securitizations and other whole loan investors. During 2011, we
had settlements of repurchase requests totaling $85 million that were charged against the reserve. The table
below summarizes changes in our representation and warranty reserves for the years ended December 31, 2011
and 2010.
The following table summarizes changes in our representation and warranty reserve for the full years of 2011 and
2010.
Table 15: Changes in Representation and Warranty Reserve
Year Ended December 31,
(Dollars in millions) 2011 2010
Representation and warranty repurchase reserve, beginning of period(1) .............. $816 $238
Provision for repurchase losses(2) ............................................ 212 636
Net realized losses ........................................................ (85) (58)
Representation and warranty repurchase reserve, end of period(1) ................... $943 $816
(1) Reported in our consolidated balance sheets as a component of other liabilities.
(2) The pre-tax portion of the provision for mortgage repurchase claims recognized in our consolidated statements of income
as a component of non-interest income totaled $43 million and $204 million in 2011 and 2010, respectively. The pre-tax
portion of the provision for mortgage repurchase claims recognized in our consolidated statements of income as a
component of discontinued operations totaled $169 million and $432 million in 2011 and 2010, respectively.
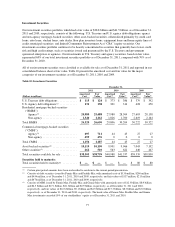
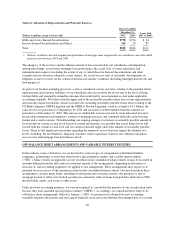
As indicated in the table below, most of the reserves relate to the $11 billion in original principal balance of
mortgage loans sold directly to the GSEs and to the $13 billion in mortgage loans sold to purchasers who placed
them into Active Insured Securitizations.
84