Capital One 2011 Annual Report Download - page 279
Download and view the complete annual report
Please find page 279 of the 2011 Capital One annual report below. You can navigate through the pages in the report by either clicking on the pages listed below, or by using the keyword search tool below to find specific information within the annual report.-
 1
1 -
2
-
3
-
4
-
5
-
6
-
7
-
8
-
9
-
10
-
11
-
12
-
13
-
14
-
15
-
16
-
17
-
18
-
19
-
20
-
21
-
22
-
23
-
24
-
25
-
26
-
27
-
28
-
29
-
30
-
31
-
32
-
33
-
34
-
35
-
36
-
37
-
38
-
39
-
40
-
41
-
42
-
43
-
44
-
45
-
46
-
47
-
48
-
49
-
50
-
51
-
52
-
53
-
54
-
55
-
56
-
57
-
58
-
59
-
60
-
61
-
62
-
63
-
64
-
65
-
66
-
67
-
68
-
69
-
70
-
71
-
72
-
73
-
74
-
75
-
76
-
77
-
78
-
79
-
80
-
81
-
82
-
83
-
84
-
85
-
86
-
87
-
88
-
89
-
90
-
91
-
92
-
93
-
94
-
95
-
96
-
97
-
98
-
99
-
100
-
101
-
102
-
103
-
104
-
105
-
106
-
107
-
108
-
109
-
110
-
111
-
112
-
113
-
114
-
115
-
116
-
117
-
118
-
119
-
120
-
121
-
122
-
123
-
124
-
125
-
126
-
127
-
128
-
129
-
130
-
131
-
132
-
133
-
134
-
135
-
136
-
137
-
138
-
139
-
140
-
141
-
142
-
143
-
144
-
145
-
146
-
147
-
148
-
149
-
150
-
151
-
152
-
153
-
154
-
155
-
156
-
157
-
158
-
159
-
160
-
161
-
162
-
163
-
164
-
165
-
166
-
167
-
168
-
169
-
170
-
171
-
172
-
173
-
174
-
175
-
176
-
177
-
178
-
179
-
180
-
181
-
182
-
183
-
184
-
185
-
186
-
187
-
188
-
189
-
190
-
191
-
192
-
193
-
194
-
195
-
196
-
197
-
198
-
199
-
200
-
201
-
202
-
203
-
204
-
205
-
206
-
207
-
208
-
209
-
210
-
211
-
212
-
213
-
214
-
215
-
216
-
217
-
218
-
219
-
220
-
221
-
222
-
223
-
224
-
225
-
226
-
227
-
228
-
229
-
230
-
231
-
232
-
233
-
234
-
235
-
236
-
237
-
238
-
239
-
240
-
241
-
242
-
243
-
244
-
245
-
246
-
247
-
248
-
249
-
250
-
251
-
252
-
253
-
254
-
255
-
256
-
257
-
258
-
259
-
260
-
261
-
262
-
263
-
264
-
265
-
266
-
267
-
268
-
 269
269 -
 270
270 -
 271
271 -
 272
272 -
 273
273 -
 274
274 -
 275
275 -
 276
276 -
 277
277 -
 278
278 -
 279
279 -
 280
280 -
 281
281 -
 282
282 -
 283
283 -
 284
284 -
 285
285 -
 286
286 -
 287
287 -
 288
288 -
 289
289 -
290
-
291
-
292
-
293
-
294
-
295
-
296
-
297
-
298
 |
 |

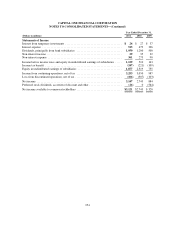
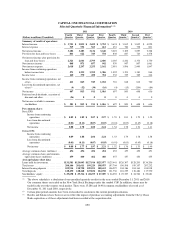
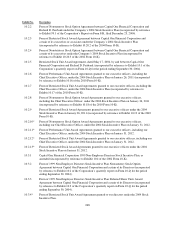
CAPITAL ONE FINANCIAL CORPORATION
Selected Quarterly Financial Information(1) (2)
2011 2010
(Dollars in millions)(Unaudited)
Fourth
Quarter
Third
Quarter
Second
Quarter
First
Quarter
Fourth
Quarter
Third
Quarter(3)
Second
Quarter(3)
First
Quarter(3)
Summary of results of operations:
Interest income .................... $ 3,701 $ 3,835 $ 3,699 $ 3,752 $ 3,674 $ 3,815 $ 3,835 $ 4,029
Interest expense .................... 519 552 563 612 651 706 738 801
Net interest income ................. 3,182 3,283 3,136 3,140 3,023 3,109 3,097 3,228
Provision for loan and lease losses ..... 861 622 343 534 838 867 723 1,478
Net interest income after provision for
loan and lease losses .............. 2,321 2,661 2,793 2,606 2,185 2,242 2,374 1,750
Non-interest income ................ 868 871 857 942 939 907 807 1,061
Non-interest expense ................ 2,618 2,297 2,255 2,162 2,091 1,996 2,000 1,847
Income from continuing operations
before income taxes .............. 571 1,235 1,395 1,386 1,032 1,153 1,181 964
Income taxes ...................... 160 370 450 354 332 335 369 244
Income from continuing operations, net
oftax .......................... 411 865 945 1,032 701 818 812 720
Loss from discontinued operations, net
of tax(2) ........................ (4) (52) (34) (16) (4) (15) (204) (84)
Net income ....................... 407 813 911 1,016 697 803 608 636
Preferred stock dividends, accretion of
discount and other ................ (26) 0 0 0 0000
Net income available to common
stockholders .................... $ 381 $ 813 $ 911 $ 1,016 $ 697 $ 803 $ 608 $ 636
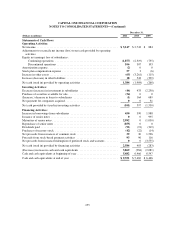
Per common share:
Basic EPS:
Income from continuing
operations .................. $ 0.89 $ 1.89 $ 2.07 $ 2.27 $ 1.55 $ 1.81 $ 1.79 $ 1.59
Loss from discontinued
operations .................. (0.01) (0.11) (0.07) (0.03) (0.01) (0.03) (0.45) (0.18)
Net income ................... 0.88 1.78 2.00 2.24 1.54 1.78 1.34 1.41
Diluted EPS:
Income from continuing
operations .................. 0.89 1.88 2.04 2.24 1.53 1.79 1.78 1.58
Loss from discontinued
operations .................. (0.01) (0.11) (0.07) (0.03) (0.01) (0.03) (0.45) (0.18)
Net income ................... $ 0.88 $ 1.77 $ 1.97 $ 2.21 $ 1.52 $ 1.76 $ 1.33 $ 1.40
Average common shares (millions) .... 456 456 456 454 453 453 452 451
Average common shares and common
equivalent shares (millions) ........ 459 460 462 460 457 457 456 455
Average balance sheet data:
Loans held for investment ............ $131,581 $129,043 $127,916 $125,077 $125,441 $126,307 $128,203 $134,206
Total assets ....................... 200,106 201,611 199,229 198,075 197,704 196,598 199,357 207,232
Interest-bearing deposits ............. 109,914 110,750 109,251 108,633 106,597 104,186 104,163 104,018
Total deposits ..................... 128,450 128,268 125,834 124,158 121,736 118,255 118,484 117,530
Stockholders’ equity ................ $ 29,698 $ 29,316 $ 28,255 $ 27,009 $ 26,255 $ 25,307 $ 24,526 $ 23,681
(1) The above schedule is a tabulation of our unaudited quarterly results for the years ended December 31, 2011 and 2010.
Our common shares are traded on the New York Stock Exchange under the symbol COF. In addition, shares may be
traded in the over-the-counter stock market. There were 15,286 and 14,981 common stockholders of record as of
December 31, 2011 and 2010, respectively.
(2) Certain prior period amounts have been reclassified to conform to the current period presentation.
(3) Results and balances have been recast to reflect the impact of purchase accounting adjustments from the Chevy Chase
Bank acquisition as if those adjustments had been recorded at the acquisition date.
259