Capital One 2011 Annual Report Download - page 196
Download and view the complete annual report
Please find page 196 of the 2011 Capital One annual report below. You can navigate through the pages in the report by either clicking on the pages listed below, or by using the keyword search tool below to find specific information within the annual report.-
 1
1 -
2
-
3
-
4
-
5
-
6
-
7
-
8
-
9
-
10
-
11
-
12
-
13
-
14
-
15
-
16
-
17
-
18
-
19
-
20
-
21
-
22
-
23
-
24
-
25
-
26
-
27
-
28
-
29
-
30
-
31
-
32
-
33
-
34
-
35
-
36
-
37
-
38
-
39
-
40
-
41
-
42
-
43
-
44
-
45
-
46
-
47
-
48
-
49
-
50
-
51
-
52
-
53
-
54
-
55
-
56
-
57
-
58
-
59
-
60
-
61
-
62
-
63
-
64
-
65
-
66
-
67
-
68
-
69
-
70
-
71
-
72
-
73
-
74
-
75
-
76
-
77
-
78
-
79
-
80
-
81
-
82
-
83
-
84
-
85
-
86
-
87
-
88
-
89
-
90
-
91
-
92
-
93
-
94
-
95
-
96
-
97
-
98
-
99
-
100
-
101
-
102
-
103
-
104
-
105
-
106
-
107
-
108
-
109
-
110
-
111
-
112
-
113
-
114
-
115
-
116
-
117
-
118
-
119
-
120
-
121
-
122
-
123
-
124
-
125
-
126
-
127
-
128
-
129
-
130
-
131
-
132
-
133
-
134
-
135
-
136
-
137
-
138
-
139
-
140
-
141
-
142
-
143
-
144
-
145
-
146
-
147
-
148
-
149
-
150
-
151
-
152
-
153
-
154
-
155
-
156
-
157
-
158
-
159
-
160
-
161
-
162
-
163
-
164
-
165
-
166
-
167
-
168
-
169
-
170
-
171
-
172
-
173
-
174
-
175
-
176
-
177
-
178
-
179
-
180
-
181
-
182
-
183
-
184
-
185
-
 186
186 -
 187
187 -
 188
188 -
 189
189 -
 190
190 -
 191
191 -
 192
192 -
 193
193 -
 194
194 -
 195
195 -
 196
196 -
 197
197 -
 198
198 -
 199
199 -
 200
200 -
 201
201 -
 202
202 -
 203
203 -
 204
204 -
 205
205 -
 206
206 -
207
-
208
-
209
-
210
-
211
-
212
-
213
-
214
-
215
-
216
-
217
-
218
-
219
-
220
-
221
-
222
-
223
-
224
-
225
-
226
-
227
-
228
-
229
-
230
-
231
-
232
-
233
-
234
-
235
-
236
-
237
-
238
-
239
-
240
-
241
-
242
-
243
-
244
-
245
-
246
-
247
-
248
-
249
-
250
-
251
-
252
-
253
-
254
-
255
-
256
-
257
-
258
-
259
-
260
-
261
-
262
-
263
-
264
-
265
-
266
-
267
-
268
-
269
-
270
-
271
-
272
-
273
-
274
-
275
-
276
-
277
-
278
-
279
-
280
-
281
-
282
-
283
-
284
-
285
-
286
-
287
-
288
-
289
-
290
-
291
-
292
-
293
-
294
-
295
-
296
-
297
-
298
 |
 |

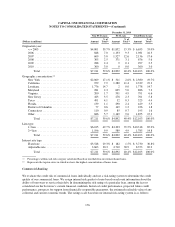
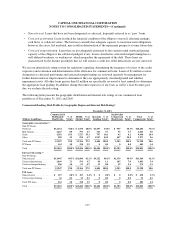
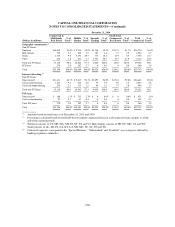
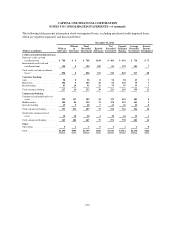
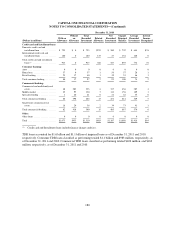
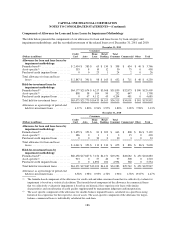
CAPITAL ONE FINANCIAL CORPORATION
NOTES TO CONSOLIDATED STATEMENTS—(Continued)
December 31, 2010
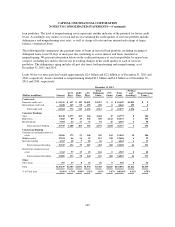
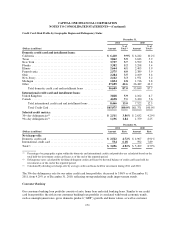
Non-PCI Loans PCI Loans Total Home Loans
(Dollars in millions) Amount
% of
Total(1) Amount
% of
Total(1) Amount
% of
Total(1)
Origination year:
< = 2005 .................................. $4,801 39.7% $1,852 15.3% $ 6,653 55.0%
2006 ..................................... 848 7.0 1,133 9.3 1,981 16.3
2007 ..................................... 609 5.0 1,527 12.6 2,136 17.6
2008 ..................................... 305 2.5 371 3.1 676 5.6
2009 ..................................... 288 2.4 9 0.1 297 2.5
2010 ..................................... 360 3.0 0 0.0 360 3.0
Total ................................. $7,211 59.6% $4,892 40.4% $12,103 100.0%
Geographic concentration:(2)
New York ................................. $2,069 17.1% $ 311 2.6% $ 2,380 19.7%
California ................................. 959 7.9 1,380 11.4 2,339 19.3
Louisiana ................................. 1,776 14.7 2 0.0 1,778 14.7
Maryland ................................. 281 2.3 605 5.0 886 7.3
Virginia ................................... 200 1.7 591 4.9 791 6.6
New Jersey ................................ 423 3.5 278 2.3 701 5.8
Texas .................................... 491 4.1 32 0.3 523 4.4
Florida ................................... 139 1.1 290 2.4 429 3.5
District of Columbia ......................... 77 0.6 149 1.2 226 1.8
Connecticut ................................ 110 0.9 85 0.7 195 1.6
Other ..................................... 686 5.7 1,169 9.6 1,855 15.3
Total ................................. $7,211 59.6% $4,892 40.4% $12,103 100.0%
Lien type:
1st lien .................................... $6,015 49.7% $4,303 35.5% $10,318 85.2%
2nd lien ................................... 1,196 9.9 589 4.9 1,785 14.8
Total ................................. $7,211 59.6% $4,892 40.4% $12,103 100.0%
Interest rate type:
Fixed rate ................................. $3,548 29.3% $ 182 1.5% $ 3,730 30.8%
Adjustable rate ............................. 3,663 30.3 4,710 38.9 8,373 69.2
Total ................................. $7,211 59.6% $4,892 40.4% $12,103 100.0%
(1) Percentages within each risk category calculated based on total held-for-investment home loans.
(2) Represents the top ten states in which we have the highest concentration of home loans.
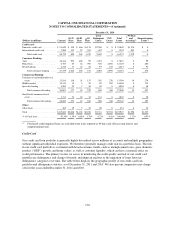
Commercial Banking
We evaluate the credit risk of commercial loans individually and use a risk-rating system to determine the credit
quality of our commercial loans. We assign internal risk grades to loans based on relevant information about the
ability of borrowers to service their debt. In determining the risk rating of a particular loan, among the factors
considered are the borrower’s current financial condition, historical credit performance, projected future credit
performance, prospects for support from financially responsible guarantors, the estimated realizable value of any
collateral and current economic trends. The ratings scale based on our internal risk-rating system is as follows:
176