Capital One 2011 Annual Report Download - page 229
Download and view the complete annual report
Please find page 229 of the 2011 Capital One annual report below. You can navigate through the pages in the report by either clicking on the pages listed below, or by using the keyword search tool below to find specific information within the annual report.-
 1
1 -
2
-
3
-
4
-
5
-
6
-
7
-
8
-
9
-
10
-
11
-
12
-
13
-
14
-
15
-
16
-
17
-
18
-
19
-
20
-
21
-
22
-
23
-
24
-
25
-
26
-
27
-
28
-
29
-
30
-
31
-
32
-
33
-
34
-
35
-
36
-
37
-
38
-
39
-
40
-
41
-
42
-
43
-
44
-
45
-
46
-
47
-
48
-
49
-
50
-
51
-
52
-
53
-
54
-
55
-
56
-
57
-
58
-
59
-
60
-
61
-
62
-
63
-
64
-
65
-
66
-
67
-
68
-
69
-
70
-
71
-
72
-
73
-
74
-
75
-
76
-
77
-
78
-
79
-
80
-
81
-
82
-
83
-
84
-
85
-
86
-
87
-
88
-
89
-
90
-
91
-
92
-
93
-
94
-
95
-
96
-
97
-
98
-
99
-
100
-
101
-
102
-
103
-
104
-
105
-
106
-
107
-
108
-
109
-
110
-
111
-
112
-
113
-
114
-
115
-
116
-
117
-
118
-
119
-
120
-
121
-
122
-
123
-
124
-
125
-
126
-
127
-
128
-
129
-
130
-
131
-
132
-
133
-
134
-
135
-
136
-
137
-
138
-
139
-
140
-
141
-
142
-
143
-
144
-
145
-
146
-
147
-
148
-
149
-
150
-
151
-
152
-
153
-
154
-
155
-
156
-
157
-
158
-
159
-
160
-
161
-
162
-
163
-
164
-
165
-
166
-
167
-
168
-
169
-
170
-
171
-
172
-
173
-
174
-
175
-
176
-
177
-
178
-
179
-
180
-
181
-
182
-
183
-
184
-
185
-
186
-
187
-
188
-
189
-
190
-
191
-
192
-
193
-
194
-
195
-
196
-
197
-
198
-
199
-
200
-
201
-
202
-
203
-
204
-
205
-
206
-
207
-
208
-
209
-
210
-
211
-
212
-
213
-
214
-
215
-
216
-
217
-
218
-
 219
219 -
 220
220 -
 221
221 -
 222
222 -
 223
223 -
 224
224 -
 225
225 -
 226
226 -
 227
227 -
 228
228 -
 229
229 -
 230
230 -
 231
231 -
 232
232 -
 233
233 -
 234
234 -
 235
235 -
 236
236 -
 237
237 -
 238
238 -
 239
239 -
240
-
241
-
242
-
243
-
244
-
245
-
246
-
247
-
248
-
249
-
250
-
251
-
252
-
253
-
254
-
255
-
256
-
257
-
258
-
259
-
260
-
261
-
262
-
263
-
264
-
265
-
266
-
267
-
268
-
269
-
270
-
271
-
272
-
273
-
274
-
275
-
276
-
277
-
278
-
279
-
280
-
281
-
282
-
283
-
284
-
285
-
286
-
287
-
288
-
289
-
290
-
291
-
292
-
293
-
294
-
295
-
296
-
297
-
298
 |
 |

CAPITAL ONE FINANCIAL CORPORATION
NOTES TO CONSOLIDATED STATEMENTS—(Continued)
December 31, 2011 and 2010, respectively. If our debt credit rating had fallen below investment grade, we would
have been required to post additional collateral of $39 million as of December 31, 2011 and 2010.
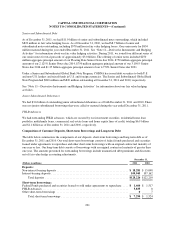
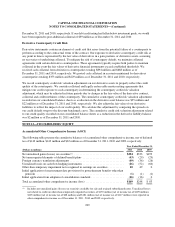
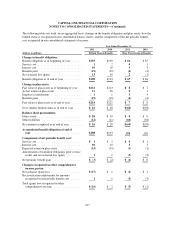
Derivative Counterparty Credit Risk
Derivative instruments contain an element of credit risk that arises from the potential failure of a counterparty to
perform according to the contractual terms of the contract. Our exposure to derivative counterparty credit risk at
any point in time is represented by the fair value of derivatives in a gain position, or derivative assets, assuming
no recoveries of underlying collateral. To mitigate the risk of counterparty default, we maintain collateral
agreements with certain derivative counterparties. These agreements typically require both parties to maintain
collateral in the event the fair values of derivative financial instruments exceed established thresholds. We
received cash collateral from derivatives counterparties totaling $894 million and $668 million as of
December 31, 2011 and 2010, respectively. We posted cash collateral in accounts maintained by derivatives
counterparties totaling $353 million and $229 million as of December 31, 2011 and 2010, respectively.
We record counterparty credit risk valuation adjustments on our derivative assets to properly reflect the credit
quality of the counterparty. We consider collateral and legally enforceable master netting agreements that
mitigate our credit exposure to each counterparty in determining the counterparty credit risk valuation
adjustment, which may be adjusted in future periods due to changes in the fair value of the derivative contract,
collateral and creditworthiness of the counterparty. The cumulative counterparty credit risk valuation adjustment
recorded on our consolidated balance sheets as a reduction in the derivative asset balance was $25 million and
$22 million as of December 31, 2011 and 2010, respectively. We also adjust the fair value of our derivative
liabilities to reflect the impact of our credit quality. We calculate this adjustment by comparing the spreads on
our credit default swaps to the discount benchmark curve. The cumulative credit risk valuation adjustment related
to our credit quality recorded on our consolidated balance sheets as a reduction in the derivative liability balance
was $2 million as of December 31, 2011 and 2010.
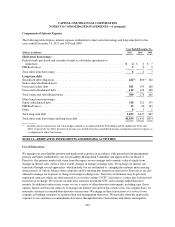
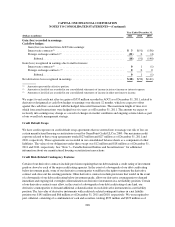
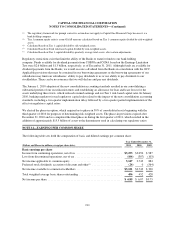
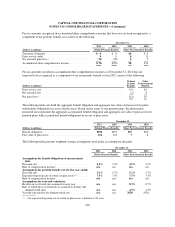
NOTE 12—STOCKHOLDERS’ EQUITY
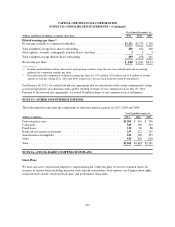
Accumulated Other Comprehensive Income (AOCI)
The following table presents the cumulative balances of accumulated other comprehensive income, net of deferred
tax of $142 million, $143 million and $67 million as of December 31, 2011, 2010 and 2009, respectively:
Year Ended December 31,
(Dollars in millions) 2011 2010 2009
Net unrealized gains (losses) on securities(1) ................................... $294 $333 $199
Net unrecognized elements of defined benefit plans ............................. (43) (29) (29)
Foreign currency translation adjustments ...................................... (49) (36) (26)
Unrealized losses on cash flow hedging instruments ............................. (26) (52) (60)
Other-than-temporary impairment not recognized in earnings on securities ........... 10 49 0
Initial application of measurement date provisions for postretirement benefits other than
pensions ............................................................. (1) (1) (1)
Initial application from adoption of consolidation standards ....................... (16) (16) 0
Total accumulated other comprehensive income (loss) ........................... $169 $248 $ 83
(1) Includes net unrealized gains (losses) on securities available for sale and retained subordinated notes. Unrealized losses
not related to credit on other-than-temporarily impaired securities of $170 million (net of income tax of $109 million),
$105 million (net of income tax of $68 million) and $181 million (net of income tax of $117 million) were reported in
other comprehensive income as of December 31, 2011, 2010 and 2009, respectively.
209