Capital One 2011 Annual Report Download - page 181
Download and view the complete annual report
Please find page 181 of the 2011 Capital One annual report below. You can navigate through the pages in the report by either clicking on the pages listed below, or by using the keyword search tool below to find specific information within the annual report.-
 1
1 -
2
-
3
-
4
-
5
-
6
-
7
-
8
-
9
-
10
-
11
-
12
-
13
-
14
-
15
-
16
-
17
-
18
-
19
-
20
-
21
-
22
-
23
-
24
-
25
-
26
-
27
-
28
-
29
-
30
-
31
-
32
-
33
-
34
-
35
-
36
-
37
-
38
-
39
-
40
-
41
-
42
-
43
-
44
-
45
-
46
-
47
-
48
-
49
-
50
-
51
-
52
-
53
-
54
-
55
-
56
-
57
-
58
-
59
-
60
-
61
-
62
-
63
-
64
-
65
-
66
-
67
-
68
-
69
-
70
-
71
-
72
-
73
-
74
-
75
-
76
-
77
-
78
-
79
-
80
-
81
-
82
-
83
-
84
-
85
-
86
-
87
-
88
-
89
-
90
-
91
-
92
-
93
-
94
-
95
-
96
-
97
-
98
-
99
-
100
-
101
-
102
-
103
-
104
-
105
-
106
-
107
-
108
-
109
-
110
-
111
-
112
-
113
-
114
-
115
-
116
-
117
-
118
-
119
-
120
-
121
-
122
-
123
-
124
-
125
-
126
-
127
-
128
-
129
-
130
-
131
-
132
-
133
-
134
-
135
-
136
-
137
-
138
-
139
-
140
-
141
-
142
-
143
-
144
-
145
-
146
-
147
-
148
-
149
-
150
-
151
-
152
-
153
-
154
-
155
-
156
-
157
-
158
-
159
-
160
-
161
-
162
-
163
-
164
-
165
-
166
-
167
-
168
-
169
-
170
-
 171
171 -
 172
172 -
 173
173 -
 174
174 -
 175
175 -
 176
176 -
 177
177 -
 178
178 -
 179
179 -
 180
180 -
 181
181 -
 182
182 -
 183
183 -
 184
184 -
 185
185 -
 186
186 -
 187
187 -
 188
188 -
 189
189 -
 190
190 -
 191
191 -
192
-
193
-
194
-
195
-
196
-
197
-
198
-
199
-
200
-
201
-
202
-
203
-
204
-
205
-
206
-
207
-
208
-
209
-
210
-
211
-
212
-
213
-
214
-
215
-
216
-
217
-
218
-
219
-
220
-
221
-
222
-
223
-
224
-
225
-
226
-
227
-
228
-
229
-
230
-
231
-
232
-
233
-
234
-
235
-
236
-
237
-
238
-
239
-
240
-
241
-
242
-
243
-
244
-
245
-
246
-
247
-
248
-
249
-
250
-
251
-
252
-
253
-
254
-
255
-
256
-
257
-
258
-
259
-
260
-
261
-
262
-
263
-
264
-
265
-
266
-
267
-
268
-
269
-
270
-
271
-
272
-
273
-
274
-
275
-
276
-
277
-
278
-
279
-
280
-
281
-
282
-
283
-
284
-
285
-
286
-
287
-
288
-
289
-
290
-
291
-
292
-
293
-
294
-
295
-
296
-
297
-
298
 |
 |
CAPITAL ONE FINANCIAL CORPORATION
NOTES TO CONSOLIDATED STATEMENTS—(Continued)
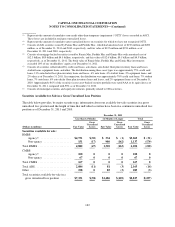
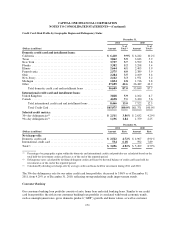
Securities Amortized Cost and Fair Value
All of our investment securities were classified as available-for-sale as of December 31, 2011 and 2010, and are
reported in our consolidated balance sheet at fair value. The following tables present the amortized cost, fair
values and corresponding gross unrealized gains (losses), by major security type, for our investment securities as
of December 31, 2011 and 2010. The gross unrealized gains (losses) related to our available-for-sale securities
are recorded, net of tax, as a component of accumulated other comprehensive income (“AOCI”).
December 31, 2011
(Dollars in millions)
Amortized
Cost
Total
Gross
Unrealized
Gains
Gross
Unrealized
Losses-
OTTI(1)
Gross
Unrealized
Losses-
Other(2)
Total
Gross
Unrealized
Losses
Fair
Value
Securities available for sale:
U.S. Treasury debt obligations ................ $ 115 $ 9 $ 0 $ 0 $ 0 $ 124
U.S. Agency debt obligations(3) ................ 131 7 0 0 0 138
Residential mortgage-backed securities (“RMBS”):
Agency(4) ............................. 24,980 539 0 (31) (31) 25,488
Non-agency ........................... 1,340 1 (170) (9) (179) 1,162
Total RMBS .............................. 26,320 540 (170) (40) (210) 26,650
Commercial mortgage-backed securities (“CMBS”):
Agency(4) ............................. 697 14 0 0 0 711
Non-agency ........................... 459 17 0 0 0 476
Total CMBS .............................. 1,156 31 0 0 0 1,187
Asset-backed securities (“ABS”)(5) ............. 10,119 45 0 (14) (14) 10,150
Other(6) ................................... 462 51 0 (3) (3) 510
Total securities available for sale .............. $38,303 $683 $(170) $ (57) $(227) $38,759
December 31, 2010
(Dollars in millions)
Amortized
Cost
Total
Gross
Unrealized
Gains
Gross
Unrealized
Losses-
OTTI(1)
Gross
Unrealized
Losses-
Other(2)
Total
Gross
Unrealized
Losses Fair Value
Securities available for sale:
U.S. Treasury debt obligations ................ $ 373 $ 13 $ 0 $ 0 $ 0 $ 386
U.S. Agency debt obligations(3) ................ 301 13 0 0 0 314
Residential mortgage-backed securities (“RMBS”):
Agency(4) ............................. 27,980 667 0 (143) (143) 28,504
Non-agency ........................... 1,826 1 (105) (22) (127) 1,700
Total RMBS .............................. 29,806 668 (105) (165) (270) 30,204
Commercial mortgage-backed securities (“CMBS”):
Agency(4) ............................. 44 1 0 0 0 45
Non-agency ........................... 0 0 0 0 0 0
Total CMBS .............................. 44 1 0 0 0 45
Asset-backed securities (“ABS”)(5) ............. 9,901 69 0 (4) (4) 9,966
Other(6) ................................... 563 66 0 (7) (7) 622
Total securities available for sale .............. $40,988 $830 $(105) $(176) $(281) $41,537
161