Capital One 2011 Annual Report Download - page 195
Download and view the complete annual report
Please find page 195 of the 2011 Capital One annual report below. You can navigate through the pages in the report by either clicking on the pages listed below, or by using the keyword search tool below to find specific information within the annual report.-
 1
1 -
2
-
3
-
4
-
5
-
6
-
7
-
8
-
9
-
10
-
11
-
12
-
13
-
14
-
15
-
16
-
17
-
18
-
19
-
20
-
21
-
22
-
23
-
24
-
25
-
26
-
27
-
28
-
29
-
30
-
31
-
32
-
33
-
34
-
35
-
36
-
37
-
38
-
39
-
40
-
41
-
42
-
43
-
44
-
45
-
46
-
47
-
48
-
49
-
50
-
51
-
52
-
53
-
54
-
55
-
56
-
57
-
58
-
59
-
60
-
61
-
62
-
63
-
64
-
65
-
66
-
67
-
68
-
69
-
70
-
71
-
72
-
73
-
74
-
75
-
76
-
77
-
78
-
79
-
80
-
81
-
82
-
83
-
84
-
85
-
86
-
87
-
88
-
89
-
90
-
91
-
92
-
93
-
94
-
95
-
96
-
97
-
98
-
99
-
100
-
101
-
102
-
103
-
104
-
105
-
106
-
107
-
108
-
109
-
110
-
111
-
112
-
113
-
114
-
115
-
116
-
117
-
118
-
119
-
120
-
121
-
122
-
123
-
124
-
125
-
126
-
127
-
128
-
129
-
130
-
131
-
132
-
133
-
134
-
135
-
136
-
137
-
138
-
139
-
140
-
141
-
142
-
143
-
144
-
145
-
146
-
147
-
148
-
149
-
150
-
151
-
152
-
153
-
154
-
155
-
156
-
157
-
158
-
159
-
160
-
161
-
162
-
163
-
164
-
165
-
166
-
167
-
168
-
169
-
170
-
171
-
172
-
173
-
174
-
175
-
176
-
177
-
178
-
179
-
180
-
181
-
182
-
183
-
184
-
 185
185 -
 186
186 -
 187
187 -
 188
188 -
 189
189 -
 190
190 -
 191
191 -
 192
192 -
 193
193 -
 194
194 -
 195
195 -
 196
196 -
 197
197 -
 198
198 -
 199
199 -
 200
200 -
 201
201 -
 202
202 -
 203
203 -
 204
204 -
 205
205 -
206
-
207
-
208
-
209
-
210
-
211
-
212
-
213
-
214
-
215
-
216
-
217
-
218
-
219
-
220
-
221
-
222
-
223
-
224
-
225
-
226
-
227
-
228
-
229
-
230
-
231
-
232
-
233
-
234
-
235
-
236
-
237
-
238
-
239
-
240
-
241
-
242
-
243
-
244
-
245
-
246
-
247
-
248
-
249
-
250
-
251
-
252
-
253
-
254
-
255
-
256
-
257
-
258
-
259
-
260
-
261
-
262
-
263
-
264
-
265
-
266
-
267
-
268
-
269
-
270
-
271
-
272
-
273
-
274
-
275
-
276
-
277
-
278
-
279
-
280
-
281
-
282
-
283
-
284
-
285
-
286
-
287
-
288
-
289
-
290
-
291
-
292
-
293
-
294
-
295
-
296
-
297
-
298
 |
 |

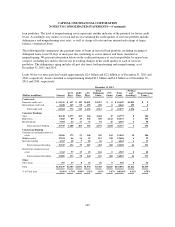
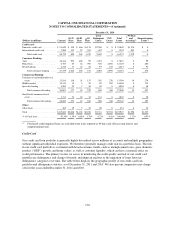
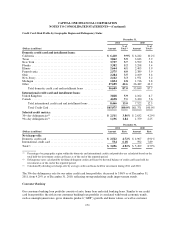
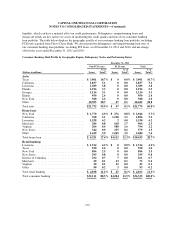
CAPITAL ONE FINANCIAL CORPORATION
NOTES TO CONSOLIDATED STATEMENTS—(Continued)
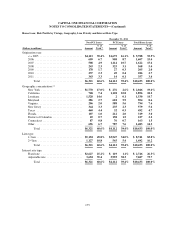
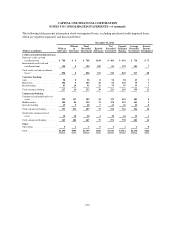
Home Loan: Risk Profile by Vintage, Geography, Lien Priority and Interest Rate Type
December 31, 2011
Non-PCI Loans PCI Loans Total Home Loans
(Dollars in millions) Amount
% of
Total(1) Amount
% of
Total(1) Amount
% of
Total(1)
Origination year:
< = 2005 .............................. $4,113 39.4% $1,675 16.1% $ 5,788 55.5%
2006 ................................. 699 6.7 908 8.7 1,607 15.4
2007 ................................. 508 4.9 1,114 10.7 1,622 15.6
2008 ................................. 243 2.3 325 3.1 568 5.4
2009 ................................. 178 1.7 27 0.3 205 2.0
2010 ................................. 237 2.3 49 0.4 286 2.7
2011 ................................. 343 3.3 14 0.1 357 3.4
Total ............................. $6,321 60.6% $4,112 39.4% $10,433 100.0%
Geographic concentration:(2)
New York ............................. $1,770 17.0% $ 276 2.6% $ 2,046 19.6%
California ............................. 768 7.4 1,128 10.8 1,896 18.2
Louisiana ............................. 1,528 14.6 2 0.1 1,530 14.7
Maryland ............................. 286 2.7 618 5.9 904 8.6
Virginia ............................... 206 2.0 588 5.6 794 7.6
New Jersey ............................ 344 3.3 235 2.3 579 5.6
Texas ................................ 460 4.4 32 0.3 492 4.7
Florida ............................... 107 1.0 212 2.0 319 3.0
District of Columbia ..................... 69 0.7 158 1.5 227 2.2
Connecticut ............................ 87 0.8 76 0.7 163 1.5
Other ................................. 696 6.7 787 7.6 1,483 14.3
Total ............................. $6,321 60.6% $4,112 39.4% $10,433 100.0%
Lien type:
1st lien ................................ $5,194 49.8% $3,547 34.0% $ 8,741 83.8%
2nd lien ............................... 1,127 10.8 565 5.4 1,692 16.2
Total ............................. $6,321 60.6% $4,112 39.4% $10,433 100.0%
Interest rate type:
Fixed rate ............................. $2,627 25.2% $ 119 1.1% $ 2,746 26.3%
Adjustable rate ......................... 3,694 35.4 3,993 38.3 7,687 73.7
Total ............................. $6,321 60.6% $4,112 39.4% $10,433 100.0%
175