Capital One 2011 Annual Report Download - page 158
Download and view the complete annual report
Please find page 158 of the 2011 Capital One annual report below. You can navigate through the pages in the report by either clicking on the pages listed below, or by using the keyword search tool below to find specific information within the annual report.-
 1
1 -
2
-
3
-
4
-
5
-
6
-
7
-
8
-
9
-
10
-
11
-
12
-
13
-
14
-
15
-
16
-
17
-
18
-
19
-
20
-
21
-
22
-
23
-
24
-
25
-
26
-
27
-
28
-
29
-
30
-
31
-
32
-
33
-
34
-
35
-
36
-
37
-
38
-
39
-
40
-
41
-
42
-
43
-
44
-
45
-
46
-
47
-
48
-
49
-
50
-
51
-
52
-
53
-
54
-
55
-
56
-
57
-
58
-
59
-
60
-
61
-
62
-
63
-
64
-
65
-
66
-
67
-
68
-
69
-
70
-
71
-
72
-
73
-
74
-
75
-
76
-
77
-
78
-
79
-
80
-
81
-
82
-
83
-
84
-
85
-
86
-
87
-
88
-
89
-
90
-
91
-
92
-
93
-
94
-
95
-
96
-
97
-
98
-
99
-
100
-
101
-
102
-
103
-
104
-
105
-
106
-
107
-
108
-
109
-
110
-
111
-
112
-
113
-
114
-
115
-
116
-
117
-
118
-
119
-
120
-
121
-
122
-
123
-
124
-
125
-
126
-
127
-
128
-
129
-
130
-
131
-
132
-
133
-
134
-
135
-
136
-
137
-
138
-
139
-
140
-
141
-
142
-
143
-
144
-
145
-
146
-
147
-
 148
148 -
 149
149 -
 150
150 -
 151
151 -
 152
152 -
 153
153 -
 154
154 -
 155
155 -
 156
156 -
 157
157 -
 158
158 -
 159
159 -
 160
160 -
 161
161 -
 162
162 -
 163
163 -
 164
164 -
 165
165 -
 166
166 -
 167
167 -
 168
168 -
169
-
170
-
171
-
172
-
173
-
174
-
175
-
176
-
177
-
178
-
179
-
180
-
181
-
182
-
183
-
184
-
185
-
186
-
187
-
188
-
189
-
190
-
191
-
192
-
193
-
194
-
195
-
196
-
197
-
198
-
199
-
200
-
201
-
202
-
203
-
204
-
205
-
206
-
207
-
208
-
209
-
210
-
211
-
212
-
213
-
214
-
215
-
216
-
217
-
218
-
219
-
220
-
221
-
222
-
223
-
224
-
225
-
226
-
227
-
228
-
229
-
230
-
231
-
232
-
233
-
234
-
235
-
236
-
237
-
238
-
239
-
240
-
241
-
242
-
243
-
244
-
245
-
246
-
247
-
248
-
249
-
250
-
251
-
252
-
253
-
254
-
255
-
256
-
257
-
258
-
259
-
260
-
261
-
262
-
263
-
264
-
265
-
266
-
267
-
268
-
269
-
270
-
271
-
272
-
273
-
274
-
275
-
276
-
277
-
278
-
279
-
280
-
281
-
282
-
283
-
284
-
285
-
286
-
287
-
288
-
289
-
290
-
291
-
292
-
293
-
294
-
295
-
296
-
297
-
298
 |
 |

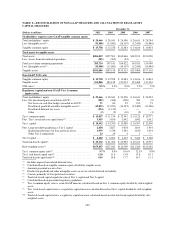
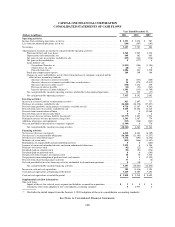
CAPITAL ONE FINANCIAL CORPORATION
CONSOLIDATED STATEMENTS OF CASH FLOWS
Year Ended December 31,
(Dollars in millions) 2011 2010 2009
Operating activities:
Income from continuing operations, net of tax ............................................. $ 3,253 $ 3,050 $ 987
Loss from discontinued operations, net of tax .............................................. (106) (307) (103)
Net income ......................................................................... 3,147 2,743 884
Adjustments to reconcile net income to cash provided by operating activities:
Provision for loan and lease losses .................................................. 2,360 3,907 4,230
Depreciation and amortization, net .................................................. 600 582 683
Net gains on sales of securities available for sale ....................................... (259) (141) (218)
Net gains on deconsolidation ....................................................... 0(177) 0
Loans held for sale:
Originations/Transfers in ...................................................... (1,031) (180) (1,194)
(Gains) losses on sales ........................................................ (28) (1) 0
Proceeds from sales .......................................................... 1,086 241 1,228
Stock plan compensation expense ................................................... 189 149 146
Changes in assets and liabilities, net of effects from purchase of companies acquired and the
effect of new accounting standards: ................................................
(Increase) decrease in interest receivable .......................................... 41 (137) (108)
(Increase) decrease in accounts receivable from securitizations(1) ....................... 24 (475) (2,015)
(Increase) decrease in other assets(1) ............................................. (150) 1,432 339
Decrease in interest payable .................................................... (22) (21) (167)
Increase (decrease) in other liabilities(1) ........................................... 1,403 (133) (1,709)
Net cash provided by (used in) operating activities attributable to discontinued operations ....... 95 353 (17)
Net cash provided by operating activities ............................................. 7,455 8,142 2,082
Investing activities:
Increase in restricted cash for securitization investors(1) ...................................... 811 2,897 727
Purchases of securities available for sale .................................................. (16,060) (26,378) (27,827)
Proceeds from paydowns and maturities of securities available for sale .......................... 9,710 11,567 9,541
Proceeds from sales of securities available for sale .......................................... 9,169 12,466 13,410
Proceeds from securitizations of loans .................................................... 00 12,068
Proceeds from sale of interest-only bonds ................................................. 057 0
Net (increase) decrease in loans held for investment(1) ....................................... (13,777) 2,607 1,934
Principal recoveries of loans previously charged off ......................................... 1,543 1,587 774
Additions of premises and equipment .................................................... (315) (340) (243)
Net cash provided by (payment for) companies acquired ..................................... (1,444) 0 778
Net cash provided by (used in) investing activities ...................................... (10,363) 4,463 11,162
Financing activities:
Net increase (decrease) in deposits ...................................................... 6,010 6,401 (6,369)
Net decrease in securitized debt obligations ............................................... (10,388) (21,385) (3,557)
Net decrease in other borrowings(1) ...................................................... 5,774 (293) (2,356)
Maturities of senior notes .............................................................. (855) (666) (1,447)
Redemptions of acquired debt and noncontrolling interests ................................... 00 (464)
Issuance of senior and subordinated notes and junior subordinated debentures .................... 2,992 0 4,500
Purchases of treasury stock ............................................................ (42) (22) (14)
Dividends paid on common stock ....................................................... (91) (91) (214)
Dividends paid on preferred stock ....................................................... 00 (105)
Net proceeds from issuances of common stock ............................................. 40 30 1,536
Net payments from redemption of preferred stock and warrants ................................ 00 (3,555)
Proceeds from share-based payment activities ............................................. 57 3 (6)
Net cash provided by (used in) financing activities attributable to discontinued operations ........... 0(18) 1
Net cash provided by (used in) financing activities ...................................... 3,497 (16,041) (12,050)
Increase in cash and cash equivalents .................................................... 589 (3,436) 1,194
Cash and cash equivalents at beginning of the period ........................................ 5,249 8,685 7,491
Cash and cash equivalents at end of the period ............................................. $ 5,838 $ 5,249 $ 8,685
Supplemental cash flow information:
Non-cash items:
Impact of the net fair value of assets acquired and liabilities assumed for acquisitions .......... $3$0$0
Cumulative effect from adoption of new consolidation accounting standards ................. 02,973 0
(1) Excludes the initial impact from the January 1, 2010 adoption of the new consolidation accounting standards.
See Notes to Consolidated Financial Statements.
138