Capital One 2011 Annual Report Download - page 250
Download and view the complete annual report
Please find page 250 of the 2011 Capital One annual report below. You can navigate through the pages in the report by either clicking on the pages listed below, or by using the keyword search tool below to find specific information within the annual report.-
 1
1 -
2
-
3
-
4
-
5
-
6
-
7
-
8
-
9
-
10
-
11
-
12
-
13
-
14
-
15
-
16
-
17
-
18
-
19
-
20
-
21
-
22
-
23
-
24
-
25
-
26
-
27
-
28
-
29
-
30
-
31
-
32
-
33
-
34
-
35
-
36
-
37
-
38
-
39
-
40
-
41
-
42
-
43
-
44
-
45
-
46
-
47
-
48
-
49
-
50
-
51
-
52
-
53
-
54
-
55
-
56
-
57
-
58
-
59
-
60
-
61
-
62
-
63
-
64
-
65
-
66
-
67
-
68
-
69
-
70
-
71
-
72
-
73
-
74
-
75
-
76
-
77
-
78
-
79
-
80
-
81
-
82
-
83
-
84
-
85
-
86
-
87
-
88
-
89
-
90
-
91
-
92
-
93
-
94
-
95
-
96
-
97
-
98
-
99
-
100
-
101
-
102
-
103
-
104
-
105
-
106
-
107
-
108
-
109
-
110
-
111
-
112
-
113
-
114
-
115
-
116
-
117
-
118
-
119
-
120
-
121
-
122
-
123
-
124
-
125
-
126
-
127
-
128
-
129
-
130
-
131
-
132
-
133
-
134
-
135
-
136
-
137
-
138
-
139
-
140
-
141
-
142
-
143
-
144
-
145
-
146
-
147
-
148
-
149
-
150
-
151
-
152
-
153
-
154
-
155
-
156
-
157
-
158
-
159
-
160
-
161
-
162
-
163
-
164
-
165
-
166
-
167
-
168
-
169
-
170
-
171
-
172
-
173
-
174
-
175
-
176
-
177
-
178
-
179
-
180
-
181
-
182
-
183
-
184
-
185
-
186
-
187
-
188
-
189
-
190
-
191
-
192
-
193
-
194
-
195
-
196
-
197
-
198
-
199
-
200
-
201
-
202
-
203
-
204
-
205
-
206
-
207
-
208
-
209
-
210
-
211
-
212
-
213
-
214
-
215
-
216
-
217
-
218
-
219
-
220
-
221
-
222
-
223
-
224
-
225
-
226
-
227
-
228
-
229
-
230
-
231
-
232
-
233
-
234
-
235
-
236
-
237
-
238
-
239
-
 240
240 -
 241
241 -
 242
242 -
 243
243 -
 244
244 -
 245
245 -
 246
246 -
 247
247 -
 248
248 -
 249
249 -
 250
250 -
 251
251 -
 252
252 -
 253
253 -
 254
254 -
 255
255 -
 256
256 -
 257
257 -
 258
258 -
 259
259 -
 260
260 -
261
-
262
-
263
-
264
-
265
-
266
-
267
-
268
-
269
-
270
-
271
-
272
-
273
-
274
-
275
-
276
-
277
-
278
-
279
-
280
-
281
-
282
-
283
-
284
-
285
-
286
-
287
-
288
-
289
-
290
-
291
-
292
-
293
-
294
-
295
-
296
-
297
-
298
 |
 |

CAPITAL ONE FINANCIAL CORPORATION
NOTES TO CONSOLIDATED STATEMENTS—(Continued)
Loans Held For Sale
Loans held for sale are carried at the lower of aggregate cost, net of deferred fees, deferred origination costs and
effects of hedge accounting, or fair value. The fair value of loans held for sale is determined using a discounted
cash flow model or fair value of the underlying collateral, less the estimated cost to sell. Held for sale loans that
are valued using a discounted cash flow are classified as level 2. Loans that are valued using fair value less the
estimated cost to sell have significant unobservable inputs and are classified as Level 3 under the fair value
hierarchy. Fair value adjustments for loans held for sale are recorded in other non-interest expense in our
consolidated statement of income.
Loans Held For Investment, Net
Loans held for investment are carried at the fair value of the underlying collateral, less the estimated cost to sell.
Due to the use of unobservable inputs, loans held for investment are classified as Level 3 under the fair value
hierarchy. Fair value adjustments for loans held for investment are recorded in provision for loan and lease losses
in the consolidated statement of income.
Foreclosed assets
Foreclosed assets are carried at the lower of its carrying amount or fair value less costs to sell. Due to the use of
unobservable inputs, foreclosed assets are classified as Level 3 under the fair value hierarchy. Fair value
adjustments for foreclosed assets are recorded in other non-interest expense in the consolidated statement of
income.
Other Assets
Nonrecurring other assets measured at fair value consist of long-lived assets held for sale. These assets are
recorded in other assets in our consolidated balance sheets. These assets are carried at the lower of their carrying
amount or fair value less costs to sell. Due to the use of unobservable inputs, long-lived assets held for sale are
classified as Level 3 under the fair value hierarchy. Fair value adjustments for other assets are recorded in other
non-interest expense in the consolidated statement of income.
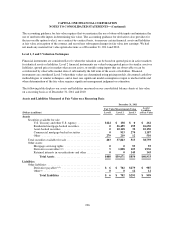
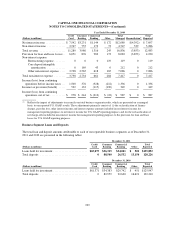
For assets measured at fair value on a nonrecurring basis and still held on the consolidated balance sheet, the
following table provides the fair value measures by level of valuation assumptions used and the gains or losses
recognized for these assets as a result of fair value measurements.
December 31, 2011
Fair Value Measurements Using Assets
at Fair
Value
Total
Gains/(Losses)(2)
(Dollars in millions) Level 1 Level 2 Level 3
Assets
Loans held for sale ............................... $0 $201 $ 0 $201 $ 0
Loans held for investment ......................... 0 0 113 113 (66)
Foreclosed assets(1) ............................... 0 0 169 169 (21)
Other .......................................... 0 0 21 21 (19)
Total ...................................... $0 $201 $303 $504 $(106)
230