Capital One 2011 Annual Report Download - page 102
Download and view the complete annual report
Please find page 102 of the 2011 Capital One annual report below. You can navigate through the pages in the report by either clicking on the pages listed below, or by using the keyword search tool below to find specific information within the annual report.-
 1
1 -
2
-
3
-
4
-
5
-
6
-
7
-
8
-
9
-
10
-
11
-
12
-
13
-
14
-
15
-
16
-
17
-
18
-
19
-
20
-
21
-
22
-
23
-
24
-
25
-
26
-
27
-
28
-
29
-
30
-
31
-
32
-
33
-
34
-
35
-
36
-
37
-
38
-
39
-
40
-
41
-
42
-
43
-
44
-
45
-
46
-
47
-
48
-
49
-
50
-
51
-
52
-
53
-
54
-
55
-
56
-
57
-
58
-
59
-
60
-
61
-
62
-
63
-
64
-
65
-
66
-
67
-
68
-
69
-
70
-
71
-
72
-
73
-
74
-
75
-
76
-
77
-
78
-
79
-
80
-
81
-
82
-
83
-
84
-
85
-
86
-
87
-
88
-
89
-
90
-
91
-
 92
92 -
 93
93 -
 94
94 -
 95
95 -
 96
96 -
 97
97 -
 98
98 -
 99
99 -
 100
100 -
 101
101 -
 102
102 -
 103
103 -
 104
104 -
 105
105 -
 106
106 -
 107
107 -
 108
108 -
 109
109 -
 110
110 -
 111
111 -
 112
112 -
113
-
114
-
115
-
116
-
117
-
118
-
119
-
120
-
121
-
122
-
123
-
124
-
125
-
126
-
127
-
128
-
129
-
130
-
131
-
132
-
133
-
134
-
135
-
136
-
137
-
138
-
139
-
140
-
141
-
142
-
143
-
144
-
145
-
146
-
147
-
148
-
149
-
150
-
151
-
152
-
153
-
154
-
155
-
156
-
157
-
158
-
159
-
160
-
161
-
162
-
163
-
164
-
165
-
166
-
167
-
168
-
169
-
170
-
171
-
172
-
173
-
174
-
175
-
176
-
177
-
178
-
179
-
180
-
181
-
182
-
183
-
184
-
185
-
186
-
187
-
188
-
189
-
190
-
191
-
192
-
193
-
194
-
195
-
196
-
197
-
198
-
199
-
200
-
201
-
202
-
203
-
204
-
205
-
206
-
207
-
208
-
209
-
210
-
211
-
212
-
213
-
214
-
215
-
216
-
217
-
218
-
219
-
220
-
221
-
222
-
223
-
224
-
225
-
226
-
227
-
228
-
229
-
230
-
231
-
232
-
233
-
234
-
235
-
236
-
237
-
238
-
239
-
240
-
241
-
242
-
243
-
244
-
245
-
246
-
247
-
248
-
249
-
250
-
251
-
252
-
253
-
254
-
255
-
256
-
257
-
258
-
259
-
260
-
261
-
262
-
263
-
264
-
265
-
266
-
267
-
268
-
269
-
270
-
271
-
272
-
273
-
274
-
275
-
276
-
277
-
278
-
279
-
280
-
281
-
282
-
283
-
284
-
285
-
286
-
287
-
288
-
289
-
290
-
291
-
292
-
293
-
294
-
295
-
296
-
297
-
298
 |
 |

databases that about $50 billion original principal balance of these mortgage loans are currently held by private-
label publicly issued securitizations not supported by bond insurance (“Uninsured Securitizations”). In contrast
with the bond insurers in Insured Securitizations, investors in Uninsured Securitizations often face a number of
legal and logistical hurdles before they can direct a securitization trustee to pursue mortgage repurchases,
including the need to coordinate with a certain percentage of investors holding the securities and to indemnify the
trustee for any litigation it undertakes. An additional approximately $22 billion original principal balance of
mortgage loans were initially sold to private investors as whole loans. Of this amount, we believe approximately
$10 billion original principal balance of mortgage loans were ultimately purchased by GSEs. For purposes of our
reserves-setting process, we consider these loans to be private-label loans rather than GSE loans. Various known
and unknown investors purchased the remaining $9 billion original principal balance of mortgage loans in this
category.
With respect to the $111 billion in original principal balance of mortgage loans originated and sold to others
between 2005 and 2008, we estimate that approximately $41 billion in unpaid principal balance remains
outstanding as of December 31, 2011, approximately $15 billion in losses have been realized and approximately
$11 billion in unpaid principal balance is at least 90 days delinquent. Because we do not service most of the loans
we sold to others, we do not have complete information about the underlying credit performance levels for some
of these mortgage loans. These amounts reflect our best estimates, including extrapolations where necessary.
These extrapolations occur on the approximately $9 billion original principal balance of mortgage loans for
which we do not have complete information about the current holders or the underlying credit performance.
These estimates could change as we get additional data or refine our analysis.
The subsidiaries had open repurchase requests relating to approximately $2.1 billion original principal balance of
mortgage loans as of December 31, 2011, compared with $1.6 billion as of December 31, 2010. As of
December 31, 2011, the majority of new repurchase demands received over the last year and, as discussed below,
the majority of our $943 million reserve relates to the $24 billion of original principal balance of mortgage loans
originally sold to the GSEs or to Active Insured Securitizations. Currently, repurchase demands predominantly
relate to the 2006 and 2007 vintages. We have received relatively few repurchase demands from the 2008 and
2009 vintages, mostly because GreenPoint ceased originating mortgages in August 2007.
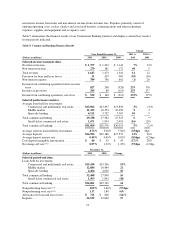
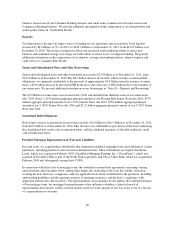
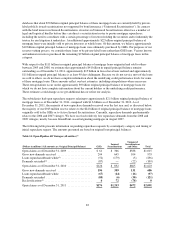
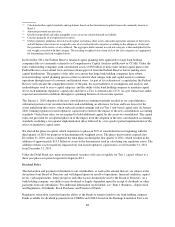
The following table presents information on pending repurchase requests by counterparty category and timing of
initial repurchase request. The amounts presented are based on original loan principal balances.
Table 14: Open Pipeline All Vintages (all entities)(1)
(Dollars in millions) (All amounts are Original Principal Balance) GSEs
Insured
Securitizations
Uninsured
Securitizations
and Other Total
Open claims as of December 31, 2009 ................. $ 61 $ 366 $588 $1,015
Gross new demands received ........................ 204 645 104 953
Loans repurchased/made whole(2) ..................... (52) (179) (5) (236)
Demands rescinded(2) ............................... (87) — (22) (109)
Open claims as of December 31, 2010 ................. $126 $ 832 $665 $1,623
Gross new demands received ........................ 196 359 131 686
Loans repurchased/made whole ...................... (67) (14) (16) (97)
Demands rescinded ................................ (85) (6) (30) (121)
Reclassifications(3) ................................. 6 72 (78) 0
Open claims as of December 31, 2011 ................. $176 $1,243 $672 $2,091
82