Capital One 2011 Annual Report Download - page 265
Download and view the complete annual report
Please find page 265 of the 2011 Capital One annual report below. You can navigate through the pages in the report by either clicking on the pages listed below, or by using the keyword search tool below to find specific information within the annual report.-
 1
1 -
2
-
3
-
4
-
5
-
6
-
7
-
8
-
9
-
10
-
11
-
12
-
13
-
14
-
15
-
16
-
17
-
18
-
19
-
20
-
21
-
22
-
23
-
24
-
25
-
26
-
27
-
28
-
29
-
30
-
31
-
32
-
33
-
34
-
35
-
36
-
37
-
38
-
39
-
40
-
41
-
42
-
43
-
44
-
45
-
46
-
47
-
48
-
49
-
50
-
51
-
52
-
53
-
54
-
55
-
56
-
57
-
58
-
59
-
60
-
61
-
62
-
63
-
64
-
65
-
66
-
67
-
68
-
69
-
70
-
71
-
72
-
73
-
74
-
75
-
76
-
77
-
78
-
79
-
80
-
81
-
82
-
83
-
84
-
85
-
86
-
87
-
88
-
89
-
90
-
91
-
92
-
93
-
94
-
95
-
96
-
97
-
98
-
99
-
100
-
101
-
102
-
103
-
104
-
105
-
106
-
107
-
108
-
109
-
110
-
111
-
112
-
113
-
114
-
115
-
116
-
117
-
118
-
119
-
120
-
121
-
122
-
123
-
124
-
125
-
126
-
127
-
128
-
129
-
130
-
131
-
132
-
133
-
134
-
135
-
136
-
137
-
138
-
139
-
140
-
141
-
142
-
143
-
144
-
145
-
146
-
147
-
148
-
149
-
150
-
151
-
152
-
153
-
154
-
155
-
156
-
157
-
158
-
159
-
160
-
161
-
162
-
163
-
164
-
165
-
166
-
167
-
168
-
169
-
170
-
171
-
172
-
173
-
174
-
175
-
176
-
177
-
178
-
179
-
180
-
181
-
182
-
183
-
184
-
185
-
186
-
187
-
188
-
189
-
190
-
191
-
192
-
193
-
194
-
195
-
196
-
197
-
198
-
199
-
200
-
201
-
202
-
203
-
204
-
205
-
206
-
207
-
208
-
209
-
210
-
211
-
212
-
213
-
214
-
215
-
216
-
217
-
218
-
219
-
220
-
221
-
222
-
223
-
224
-
225
-
226
-
227
-
228
-
229
-
230
-
231
-
232
-
233
-
234
-
235
-
236
-
237
-
238
-
239
-
240
-
241
-
242
-
243
-
244
-
245
-
246
-
247
-
248
-
249
-
250
-
251
-
252
-
253
-
254
-
 255
255 -
 256
256 -
 257
257 -
 258
258 -
 259
259 -
 260
260 -
 261
261 -
 262
262 -
 263
263 -
 264
264 -
 265
265 -
 266
266 -
 267
267 -
 268
268 -
 269
269 -
 270
270 -
 271
271 -
 272
272 -
 273
273 -
 274
274 -
 275
275 -
276
-
277
-
278
-
279
-
280
-
281
-
282
-
283
-
284
-
285
-
286
-
287
-
288
-
289
-
290
-
291
-
292
-
293
-
294
-
295
-
296
-
297
-
298
 |
 |

CAPITAL ONE FINANCIAL CORPORATION
NOTES TO CONSOLIDATED STATEMENTS—(Continued)
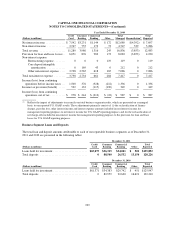
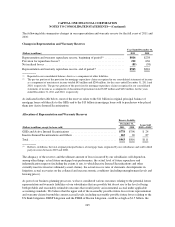
The following table summarizes changes in our representation and warranty reserve for the full years of 2011 and
2010:
Changes in Representation and Warranty Reserves
Year Ended December 31,
(Dollars in millions) 2011 2010
Representation and warranty repurchase reserve, beginning of period(1) .............. $816 $238
Provision for repurchase losses(2) ............................................ 212 636
Net realized losses ........................................................ (85) (58)
Representation and warranty repurchase reserve, end of period(1) ................... $943 $816
(1) Reported in our consolidated balance sheets as a component of other liabilities.
(2) The pre-tax portion of the provision for mortgage repurchase claims recognized in our consolidated statements of income
as a component of non-interest income totaled $43 million and $204 million, for the years ended December 31, 2011 and
2010, respectively. The pre-tax portion of the provision for mortgage repurchase claims recognized in our consolidated
statements of income as a component of discontinued operations totaled $169 million and $432 million, for the years
ended December 31, 2011 and 2010, respectively.
As indicated in the table below, most of the reserves relate to the $11 billion in original principal balance of
mortgage loans sold directly to the GSEs and to the $13 billion in mortgage loans sold to purchasers who placed
them into Active Insured Securitizations.
Allocation of Representation and Warranty Reserves
Reserve Liability
December 31, Loans Sold
2005 to 2008(1)
(Dollars in millions, except for loans sold) 2011 2010
GSEs and Active Insured Securitizations ................................ $778 $796 $ 24
Inactive Insured Securitizations and Others .............................. 165 20 87
Total ............................................................. $943 $816 $111
(1) Reflects, in billions, the total original principal balance of mortgage loans originated by our subsidiaries and sold to third
party investors between 2005 and 2008.
The adequacy of the reserves and the ultimate amount of losses incurred by our subsidiaries will depend on,
among other things, actual future mortgage loan performance, the actual level of future repurchase and
indemnification requests (including the extent, if any, to which Inactive Insured Securitizations and other
currently inactive investors ultimately assert claims), the actual success rates of claimants, developments in
litigation, actual recoveries on the collateral and macroeconomic conditions (including unemployment levels and
housing prices).
As part of our business planning processes, we have considered various outcomes relating to the potential future
representation and warranty liabilities of our subsidiaries that are possible but do not rise to the level of being
both probable and reasonably estimable outcomes that would justify an incremental accrual under applicable
accounting standards. We believe that the upper end of the reasonably possible future losses from representation
and warranty claims beyond the current accrual levels, including reasonably possible future losses relating to the
US Bank Litigation, DBSP Litigation and the FHLB of Boston Litigation, could be as high as $1.5 billion, the
245