Capital One 2011 Annual Report Download - page 189
Download and view the complete annual report
Please find page 189 of the 2011 Capital One annual report below. You can navigate through the pages in the report by either clicking on the pages listed below, or by using the keyword search tool below to find specific information within the annual report.-
 1
1 -
2
-
3
-
4
-
5
-
6
-
7
-
8
-
9
-
10
-
11
-
12
-
13
-
14
-
15
-
16
-
17
-
18
-
19
-
20
-
21
-
22
-
23
-
24
-
25
-
26
-
27
-
28
-
29
-
30
-
31
-
32
-
33
-
34
-
35
-
36
-
37
-
38
-
39
-
40
-
41
-
42
-
43
-
44
-
45
-
46
-
47
-
48
-
49
-
50
-
51
-
52
-
53
-
54
-
55
-
56
-
57
-
58
-
59
-
60
-
61
-
62
-
63
-
64
-
65
-
66
-
67
-
68
-
69
-
70
-
71
-
72
-
73
-
74
-
75
-
76
-
77
-
78
-
79
-
80
-
81
-
82
-
83
-
84
-
85
-
86
-
87
-
88
-
89
-
90
-
91
-
92
-
93
-
94
-
95
-
96
-
97
-
98
-
99
-
100
-
101
-
102
-
103
-
104
-
105
-
106
-
107
-
108
-
109
-
110
-
111
-
112
-
113
-
114
-
115
-
116
-
117
-
118
-
119
-
120
-
121
-
122
-
123
-
124
-
125
-
126
-
127
-
128
-
129
-
130
-
131
-
132
-
133
-
134
-
135
-
136
-
137
-
138
-
139
-
140
-
141
-
142
-
143
-
144
-
145
-
146
-
147
-
148
-
149
-
150
-
151
-
152
-
153
-
154
-
155
-
156
-
157
-
158
-
159
-
160
-
161
-
162
-
163
-
164
-
165
-
166
-
167
-
168
-
169
-
170
-
171
-
172
-
173
-
174
-
175
-
176
-
177
-
178
-
 179
179 -
 180
180 -
 181
181 -
 182
182 -
 183
183 -
 184
184 -
 185
185 -
 186
186 -
 187
187 -
 188
188 -
 189
189 -
 190
190 -
 191
191 -
 192
192 -
 193
193 -
 194
194 -
 195
195 -
 196
196 -
 197
197 -
 198
198 -
 199
199 -
200
-
201
-
202
-
203
-
204
-
205
-
206
-
207
-
208
-
209
-
210
-
211
-
212
-
213
-
214
-
215
-
216
-
217
-
218
-
219
-
220
-
221
-
222
-
223
-
224
-
225
-
226
-
227
-
228
-
229
-
230
-
231
-
232
-
233
-
234
-
235
-
236
-
237
-
238
-
239
-
240
-
241
-
242
-
243
-
244
-
245
-
246
-
247
-
248
-
249
-
250
-
251
-
252
-
253
-
254
-
255
-
256
-
257
-
258
-
259
-
260
-
261
-
262
-
263
-
264
-
265
-
266
-
267
-
268
-
269
-
270
-
271
-
272
-
273
-
274
-
275
-
276
-
277
-
278
-
279
-
280
-
281
-
282
-
283
-
284
-
285
-
286
-
287
-
288
-
289
-
290
-
291
-
292
-
293
-
294
-
295
-
296
-
297
-
298
 |
 |

CAPITAL ONE FINANCIAL CORPORATION
NOTES TO CONSOLIDATED STATEMENTS—(Continued)
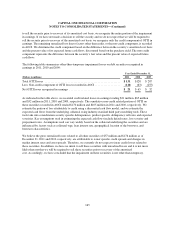
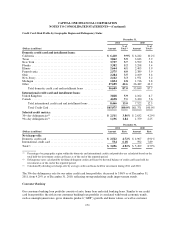
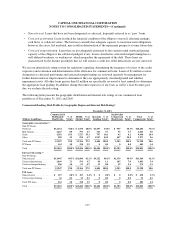
loan portfolios. The level of nonperforming assets represents another indicator of the potential for future credit
losses. Accordingly, key metrics we track and use in evaluating the credit quality of our loan portfolio include
delinquency and nonperforming asset rates, as well as charge-off rates and our internal risk ratings of larger
balance, commercial loans.
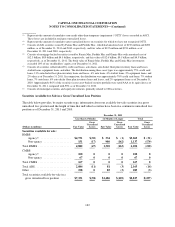
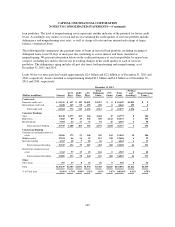
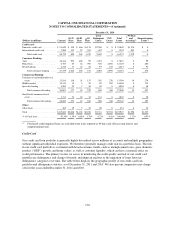
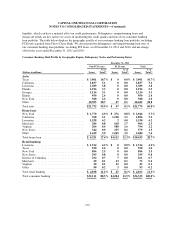
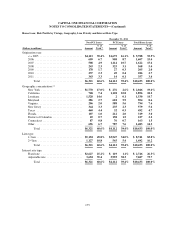
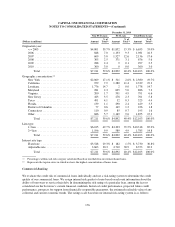
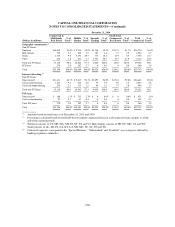
The following table summarizes the payment status of loans in our total loan portfolio, including an aging of
delinquent loans, loans 90 days or more past due continuing to accrue interest and loans classified as
nonperforming. We present information below on the credit performance of our loan portfolio, by major loan
category, including key metrics that we use in tracking changes in the credit quality of each of our loan
portfolios. The delinquency aging includes all past due loans, both performing and nonperforming, as of
December 31, 2011 and 2010.
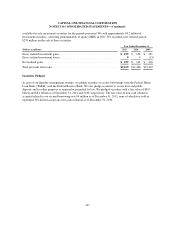
Loans 90 days or more past due totaled approximately $2.0 billion and $2.2 billion as of December 31, 2011 and
2010, respectively. Loans classified as nonperforming totaled $1.1 billion and $1.2 billion as of December 31,
2011 and 2010, respectively.
December 31, 2011
(Dollars in millions) Current
30-59
Days
60-89
Days
> 90
Days
Total
Delinquent
Loans
PCI
Loans
Total
Loans
> 90 Days
and
Accruing(1)
Nonperforming
Loans(1)
Credit card:
Domestic credit card ........... $ 54,536 $ 627 $ 445 $1,001 $2,073 $ 0 $ 56,609 $1,001 $ 0
International credit card ......... 8,028 145 98 195 438 0 8,466 195 0
Total credit card ........... 62,564 772 543 1,196 2,511 0 65,075 1,196 0
Consumer Banking:
Auto ........................ 20,128 1,075 423 106 1,604 47 21,779 0 106
Home loan ................... 5,843 89 43 346 478 4,112 10,433 1 456
Retail banking ................ 3,964 24 17 53 94 45 4,103 4 90
Total consumer banking .... 29,935 1,188 483 505 2,176 4,204 36,315 5 652
Commercial Banking:
Commercial and multifamily real
estate ..................... 14,906 172 23 146 341 163 15,410 34 206
Middle market ................ 12,254 46 11 55 112 318 12,684 6 92
Specialty lending .............. 4,363 18 5 18 41 0 4,404 1 33
Total commercial lending . . . 31,523 236 39 219 494 481 32,498 41 331
Small-ticket commercial real
estate ..................... 1,362 97 19 25 141 0 1,503 0 40
Total commercial banking . . . 32,885 333 58 244 635 481 34,001 41 371
Other:
Other loans ................... 455 13 8 25 46 0 501 0 36
Total ........................ $125,839 $2,306 $1,092 $1,970 $5,368 $4,685 $135,892 $1,242 $1,059
% of Total loans ............... 92.60% 1.70% 0.80% 1.45% 3.95% 3.45% 100.00% 0.91% 0.78%
169