Capital One 2011 Annual Report Download - page 217
Download and view the complete annual report
Please find page 217 of the 2011 Capital One annual report below. You can navigate through the pages in the report by either clicking on the pages listed below, or by using the keyword search tool below to find specific information within the annual report.-
 1
1 -
2
-
3
-
4
-
5
-
6
-
7
-
8
-
9
-
10
-
11
-
12
-
13
-
14
-
15
-
16
-
17
-
18
-
19
-
20
-
21
-
22
-
23
-
24
-
25
-
26
-
27
-
28
-
29
-
30
-
31
-
32
-
33
-
34
-
35
-
36
-
37
-
38
-
39
-
40
-
41
-
42
-
43
-
44
-
45
-
46
-
47
-
48
-
49
-
50
-
51
-
52
-
53
-
54
-
55
-
56
-
57
-
58
-
59
-
60
-
61
-
62
-
63
-
64
-
65
-
66
-
67
-
68
-
69
-
70
-
71
-
72
-
73
-
74
-
75
-
76
-
77
-
78
-
79
-
80
-
81
-
82
-
83
-
84
-
85
-
86
-
87
-
88
-
89
-
90
-
91
-
92
-
93
-
94
-
95
-
96
-
97
-
98
-
99
-
100
-
101
-
102
-
103
-
104
-
105
-
106
-
107
-
108
-
109
-
110
-
111
-
112
-
113
-
114
-
115
-
116
-
117
-
118
-
119
-
120
-
121
-
122
-
123
-
124
-
125
-
126
-
127
-
128
-
129
-
130
-
131
-
132
-
133
-
134
-
135
-
136
-
137
-
138
-
139
-
140
-
141
-
142
-
143
-
144
-
145
-
146
-
147
-
148
-
149
-
150
-
151
-
152
-
153
-
154
-
155
-
156
-
157
-
158
-
159
-
160
-
161
-
162
-
163
-
164
-
165
-
166
-
167
-
168
-
169
-
170
-
171
-
172
-
173
-
174
-
175
-
176
-
177
-
178
-
179
-
180
-
181
-
182
-
183
-
184
-
185
-
186
-
187
-
188
-
189
-
190
-
191
-
192
-
193
-
194
-
195
-
196
-
197
-
198
-
199
-
200
-
201
-
202
-
203
-
204
-
205
-
206
-
 207
207 -
 208
208 -
 209
209 -
 210
210 -
 211
211 -
 212
212 -
 213
213 -
 214
214 -
 215
215 -
 216
216 -
 217
217 -
 218
218 -
 219
219 -
 220
220 -
 221
221 -
 222
222 -
 223
223 -
 224
224 -
 225
225 -
 226
226 -
 227
227 -
228
-
229
-
230
-
231
-
232
-
233
-
234
-
235
-
236
-
237
-
238
-
239
-
240
-
241
-
242
-
243
-
244
-
245
-
246
-
247
-
248
-
249
-
250
-
251
-
252
-
253
-
254
-
255
-
256
-
257
-
258
-
259
-
260
-
261
-
262
-
263
-
264
-
265
-
266
-
267
-
268
-
269
-
270
-
271
-
272
-
273
-
274
-
275
-
276
-
277
-
278
-
279
-
280
-
281
-
282
-
283
-
284
-
285
-
286
-
287
-
288
-
289
-
290
-
291
-
292
-
293
-
294
-
295
-
296
-
297
-
298
 |
 |

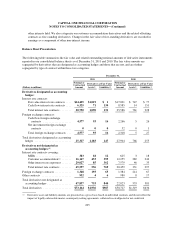
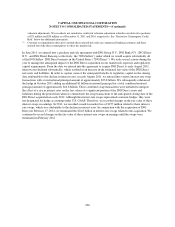
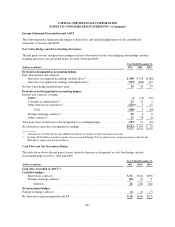
CAPITAL ONE FINANCIAL CORPORATION
NOTES TO CONSOLIDATED STATEMENTS—(Continued)
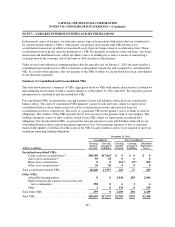
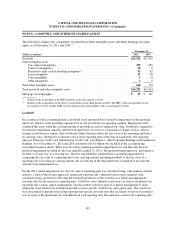
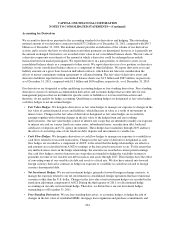
The following table summarizes our intangible assets subject to amortization as of December 31, 2011 and 2010:
December 31, 2011
(Dollars in millions)
Carrying
Amount of
Assets
Accumulated
Amortization
Currency
valuation
Adjustments
Net
Carrying
Amount
Remaining
Amortization
Period
Core deposit intangibles ...................... $1,562 $(1,083) $ 0 $479 5.9 years
Purchased credit card relationship intangibles(1) ... 77 (25) 0 52 5.2 years
Contract intangibles(2) ........................ 70 (19) (1) 50 6.0 years
Lease intangibles ............................ 54 (33) 0 21 20.7 years
Trust intangibles ............................ 11 (6) 0 5 11.9 years
Other intangibles ............................ 25 (22) 0 3 2.3 years
Total ..................................... $1,799 $(1,188) $(1) $610
December 31, 2010
(Dollars in millions)
Carrying
Amount of
Assets
Accumulated
Amortization
Currency
valuation
Adjustments
Net
Carrying
Amount
Remaining
Amortization
Period
Core deposit intangibles ...................... $1,562 $ (912) $ 0 $650 7.0 years
Purchased credit card relationship intangibles(1) . . . 47 (5) 0 42 6.1 years
Lease intangibles ............................ 54 (28) 0 26 21.7 years
Trust intangibles ............................ 11 (5) 0 6 12.9 years
Other intangibles ............................ 35 (26) 0 9 3.3 years
Total ..................................... $1,709 $ (976) $ 0 $733
(1) Relates to the acquisitions of the Sony Card portfolio in the third quarter of 2010, the HBC credit card portfolio in the
first quarter of 2011 and the Kohl’s private-label credit card portfolio in the second quarter of 2011.
(2) Relates to the acquisition of the existing HBC credit card portfolio in the first quarter of 2011.
Intangible assets, which are reported in other assets on our consolidated balance sheets, are amortized over their
respective estimated useful lives on an accelerated basis using the sum of the year’s digits methodology.
Intangible amortization expense, which is included in non-interest expense on our consolidated statements of
income, totaled $222 million, $220 million and $235 million in 2011, 2010 and 2009, respectively. The weighted
average amortization period for purchase accounting intangibles is 6.4 years as of December 31, 2011.
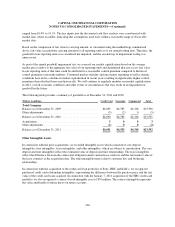
The following table summarizes the estimated future amortization expense for intangible assets as of
December 31, 2011:
(Dollars in millions)
Estimated
Future
Amortization
Amounts
2012 ........................................................................... $184
2013 ........................................................................... 148
2014 ........................................................................... 114
2015 ........................................................................... 80
2016 ........................................................................... 49
Thereafter ....................................................................... 35
Total ........................................................................... $610
197