Capital One 2011 Annual Report Download - page 118
Download and view the complete annual report
Please find page 118 of the 2011 Capital One annual report below. You can navigate through the pages in the report by either clicking on the pages listed below, or by using the keyword search tool below to find specific information within the annual report.-
 1
1 -
2
-
3
-
4
-
5
-
6
-
7
-
8
-
9
-
10
-
11
-
12
-
13
-
14
-
15
-
16
-
17
-
18
-
19
-
20
-
21
-
22
-
23
-
24
-
25
-
26
-
27
-
28
-
29
-
30
-
31
-
32
-
33
-
34
-
35
-
36
-
37
-
38
-
39
-
40
-
41
-
42
-
43
-
44
-
45
-
46
-
47
-
48
-
49
-
50
-
51
-
52
-
53
-
54
-
55
-
56
-
57
-
58
-
59
-
60
-
61
-
62
-
63
-
64
-
65
-
66
-
67
-
68
-
69
-
70
-
71
-
72
-
73
-
74
-
75
-
76
-
77
-
78
-
79
-
80
-
81
-
82
-
83
-
84
-
85
-
86
-
87
-
88
-
89
-
90
-
91
-
92
-
93
-
94
-
95
-
96
-
97
-
98
-
99
-
100
-
101
-
102
-
103
-
104
-
105
-
106
-
107
-
 108
108 -
 109
109 -
 110
110 -
 111
111 -
 112
112 -
 113
113 -
 114
114 -
 115
115 -
 116
116 -
 117
117 -
 118
118 -
 119
119 -
 120
120 -
 121
121 -
 122
122 -
 123
123 -
 124
124 -
 125
125 -
 126
126 -
 127
127 -
 128
128 -
129
-
130
-
131
-
132
-
133
-
134
-
135
-
136
-
137
-
138
-
139
-
140
-
141
-
142
-
143
-
144
-
145
-
146
-
147
-
148
-
149
-
150
-
151
-
152
-
153
-
154
-
155
-
156
-
157
-
158
-
159
-
160
-
161
-
162
-
163
-
164
-
165
-
166
-
167
-
168
-
169
-
170
-
171
-
172
-
173
-
174
-
175
-
176
-
177
-
178
-
179
-
180
-
181
-
182
-
183
-
184
-
185
-
186
-
187
-
188
-
189
-
190
-
191
-
192
-
193
-
194
-
195
-
196
-
197
-
198
-
199
-
200
-
201
-
202
-
203
-
204
-
205
-
206
-
207
-
208
-
209
-
210
-
211
-
212
-
213
-
214
-
215
-
216
-
217
-
218
-
219
-
220
-
221
-
222
-
223
-
224
-
225
-
226
-
227
-
228
-
229
-
230
-
231
-
232
-
233
-
234
-
235
-
236
-
237
-
238
-
239
-
240
-
241
-
242
-
243
-
244
-
245
-
246
-
247
-
248
-
249
-
250
-
251
-
252
-
253
-
254
-
255
-
256
-
257
-
258
-
259
-
260
-
261
-
262
-
263
-
264
-
265
-
266
-
267
-
268
-
269
-
270
-
271
-
272
-
273
-
274
-
275
-
276
-
277
-
278
-
279
-
280
-
281
-
282
-
283
-
284
-
285
-
286
-
287
-
288
-
289
-
290
-
291
-
292
-
293
-
294
-
295
-
296
-
297
-
298
 |
 |

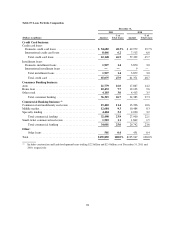
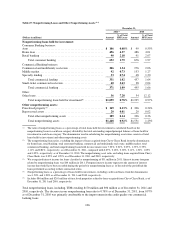
Table 19: Loan Portfolio Composition
December 31,
2011 2010
(Dollars in millions) Amount
% of
Total Loans Amount
% of
Total Loans
Credit Card business:
Credit card loans:
Domestic credit card loans ........................... $ 54,682 40.3% $ 49,979 39.7%
International credit card loans ........................ 8,466 6.2 7,513 6.0
Total credit card loans ............................ 63,148 46.5 57,492 45.7
Installment loans:
Domestic installment loans ........................... 1,927 1.4 3,870 3.0
International installment loans ........................ —— 9—
Total installment loans ............................ 1,927 1.4 3,879 3.0
Total credit card ................................. 65,075 47.9 61,371 48.7
Consumer Banking business:
Auto .............................................. 21,779 16.0 17,867 14.2
Home loan .......................................... 10,433 7.7 12,103 9.6
Other retail ......................................... 4,103 3.0 4,413 3.5
Total consumer banking ........................... 36,315 26.7 34,383 27.3
Commercial Banking business:(1)
Commercial and multifamily real estate ................... 15,410 11.4 13,396 10.6
Middle market ....................................... 12,684 9.3 10,484 8.3
Specialty lending .................................... 4,404 3.2 4,020 3.2
Total commercial lending .......................... 32,498 23.9 27,900 22.1
Small-ticket commercial real estate ...................... 1,503 1.1 1,842 1.5
Total commercial banking ......................... 34,001 25.0 29,742 23.6
Other:
Other loans ..................................... 501 0.4 451 0.4
Total .............................................. $135,892 100.0% $125,947 100.0%
(1) Includes construction and land development loans totaling $2.2 billion and $2.4 billion as of December 31, 2011 and
2010, respectively.
98