Capital One 2011 Annual Report Download - page 120
Download and view the complete annual report
Please find page 120 of the 2011 Capital One annual report below. You can navigate through the pages in the report by either clicking on the pages listed below, or by using the keyword search tool below to find specific information within the annual report.-
 1
1 -
2
-
3
-
4
-
5
-
6
-
7
-
8
-
9
-
10
-
11
-
12
-
13
-
14
-
15
-
16
-
17
-
18
-
19
-
20
-
21
-
22
-
23
-
24
-
25
-
26
-
27
-
28
-
29
-
30
-
31
-
32
-
33
-
34
-
35
-
36
-
37
-
38
-
39
-
40
-
41
-
42
-
43
-
44
-
45
-
46
-
47
-
48
-
49
-
50
-
51
-
52
-
53
-
54
-
55
-
56
-
57
-
58
-
59
-
60
-
61
-
62
-
63
-
64
-
65
-
66
-
67
-
68
-
69
-
70
-
71
-
72
-
73
-
74
-
75
-
76
-
77
-
78
-
79
-
80
-
81
-
82
-
83
-
84
-
85
-
86
-
87
-
88
-
89
-
90
-
91
-
92
-
93
-
94
-
95
-
96
-
97
-
98
-
99
-
100
-
101
-
102
-
103
-
104
-
105
-
106
-
107
-
108
-
109
-
 110
110 -
 111
111 -
 112
112 -
 113
113 -
 114
114 -
 115
115 -
 116
116 -
 117
117 -
 118
118 -
 119
119 -
 120
120 -
 121
121 -
 122
122 -
 123
123 -
 124
124 -
 125
125 -
 126
126 -
 127
127 -
 128
128 -
 129
129 -
 130
130 -
131
-
132
-
133
-
134
-
135
-
136
-
137
-
138
-
139
-
140
-
141
-
142
-
143
-
144
-
145
-
146
-
147
-
148
-
149
-
150
-
151
-
152
-
153
-
154
-
155
-
156
-
157
-
158
-
159
-
160
-
161
-
162
-
163
-
164
-
165
-
166
-
167
-
168
-
169
-
170
-
171
-
172
-
173
-
174
-
175
-
176
-
177
-
178
-
179
-
180
-
181
-
182
-
183
-
184
-
185
-
186
-
187
-
188
-
189
-
190
-
191
-
192
-
193
-
194
-
195
-
196
-
197
-
198
-
199
-
200
-
201
-
202
-
203
-
204
-
205
-
206
-
207
-
208
-
209
-
210
-
211
-
212
-
213
-
214
-
215
-
216
-
217
-
218
-
219
-
220
-
221
-
222
-
223
-
224
-
225
-
226
-
227
-
228
-
229
-
230
-
231
-
232
-
233
-
234
-
235
-
236
-
237
-
238
-
239
-
240
-
241
-
242
-
243
-
244
-
245
-
246
-
247
-
248
-
249
-
250
-
251
-
252
-
253
-
254
-
255
-
256
-
257
-
258
-
259
-
260
-
261
-
262
-
263
-
264
-
265
-
266
-
267
-
268
-
269
-
270
-
271
-
272
-
273
-
274
-
275
-
276
-
277
-
278
-
279
-
280
-
281
-
282
-
283
-
284
-
285
-
286
-
287
-
288
-
289
-
290
-
291
-
292
-
293
-
294
-
295
-
296
-
297
-
298
 |
 |

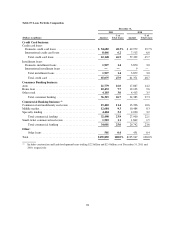
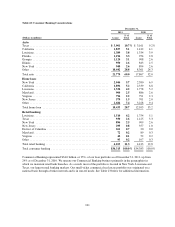
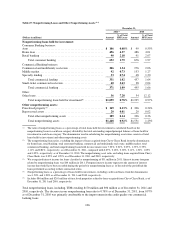
Table 21: Credit Card Concentrations
December 31,
2011 2010
(Dollars in millions) Loans
% of
Total Loans
% of
Total
Domestic card:
California ................................................... $ 6,410 9.9% $ 6,242 10.2%
Texas ....................................................... 3,862 5.9 3,633 5.9
New York ................................................... 3,737 5.7 3,599 5.8
Florida ...................................................... 3,382 5.2 3,298 5.4
Illinois ...................................................... 2,664 4.1 2,403 3.9
Pennsylvania ................................................. 2,575 4.0 2,389 3.9
Ohio........................................................ 2,284 3.5 2,109 3.4
New Jersey .................................................. 2,162 3.3 1,971 3.2
Michigan .................................................... 1,834 2.8 1,716 2.8
Other ....................................................... 27,699 42.6 26,489 43.2
Total domestic card ............................................ 56,609 87.0 53,849 87.7
International card:
United Kingdom .............................................. 3,828 5.9 4,102 6.7
Canada ...................................................... 4,638 7.1 3,420 5.6
Total international card ......................................... 8,466 13.0 7,522 12.3
Total credit card .............................................. $65,075 100.0% $61,371 100.0%
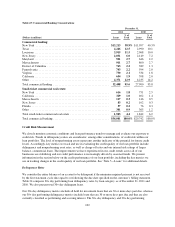
Consumer Banking accounted for $36.3 billion, or 27%, of our loan portfolio as of December 31, 2011,
compared with $34.4 billion, or 27%, of our loan portfolio as of December 31, 2010. The auto portfolio is
originated primarily on a national basis, with additional originations through the retail branch network. The home
loan portfolio is concentrated in New York, California and Louisiana which reflects the characteristics of the
legacy Hibernia, North Fork and Chevy Chase Bank portfolios that comprise the majority of our home loans.
Retail banking includes small business loans and other consumer lending products originated through our branch
network. See Table 22 below for additional information.
100