Capital One 2011 Annual Report Download - page 85
Download and view the complete annual report
Please find page 85 of the 2011 Capital One annual report below. You can navigate through the pages in the report by either clicking on the pages listed below, or by using the keyword search tool below to find specific information within the annual report.-
 1
1 -
2
-
3
-
4
-
5
-
6
-
7
-
8
-
9
-
10
-
11
-
12
-
13
-
14
-
15
-
16
-
17
-
18
-
19
-
20
-
21
-
22
-
23
-
24
-
25
-
26
-
27
-
28
-
29
-
30
-
31
-
32
-
33
-
34
-
35
-
36
-
37
-
38
-
39
-
40
-
41
-
42
-
43
-
44
-
45
-
46
-
47
-
48
-
49
-
50
-
51
-
52
-
53
-
54
-
55
-
56
-
57
-
58
-
59
-
60
-
61
-
62
-
63
-
64
-
65
-
66
-
67
-
68
-
69
-
70
-
71
-
72
-
73
-
74
-
 75
75 -
 76
76 -
 77
77 -
 78
78 -
 79
79 -
 80
80 -
 81
81 -
 82
82 -
 83
83 -
 84
84 -
 85
85 -
 86
86 -
 87
87 -
 88
88 -
 89
89 -
 90
90 -
 91
91 -
 92
92 -
 93
93 -
 94
94 -
 95
95 -
96
-
97
-
98
-
99
-
100
-
101
-
102
-
103
-
104
-
105
-
106
-
107
-
108
-
109
-
110
-
111
-
112
-
113
-
114
-
115
-
116
-
117
-
118
-
119
-
120
-
121
-
122
-
123
-
124
-
125
-
126
-
127
-
128
-
129
-
130
-
131
-
132
-
133
-
134
-
135
-
136
-
137
-
138
-
139
-
140
-
141
-
142
-
143
-
144
-
145
-
146
-
147
-
148
-
149
-
150
-
151
-
152
-
153
-
154
-
155
-
156
-
157
-
158
-
159
-
160
-
161
-
162
-
163
-
164
-
165
-
166
-
167
-
168
-
169
-
170
-
171
-
172
-
173
-
174
-
175
-
176
-
177
-
178
-
179
-
180
-
181
-
182
-
183
-
184
-
185
-
186
-
187
-
188
-
189
-
190
-
191
-
192
-
193
-
194
-
195
-
196
-
197
-
198
-
199
-
200
-
201
-
202
-
203
-
204
-
205
-
206
-
207
-
208
-
209
-
210
-
211
-
212
-
213
-
214
-
215
-
216
-
217
-
218
-
219
-
220
-
221
-
222
-
223
-
224
-
225
-
226
-
227
-
228
-
229
-
230
-
231
-
232
-
233
-
234
-
235
-
236
-
237
-
238
-
239
-
240
-
241
-
242
-
243
-
244
-
245
-
246
-
247
-
248
-
249
-
250
-
251
-
252
-
253
-
254
-
255
-
256
-
257
-
258
-
259
-
260
-
261
-
262
-
263
-
264
-
265
-
266
-
267
-
268
-
269
-
270
-
271
-
272
-
273
-
274
-
275
-
276
-
277
-
278
-
279
-
280
-
281
-
282
-
283
-
284
-
285
-
286
-
287
-
288
-
289
-
290
-
291
-
292
-
293
-
294
-
295
-
296
-
297
-
298
 |
 |

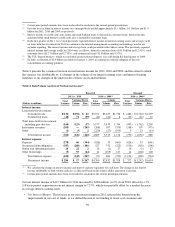
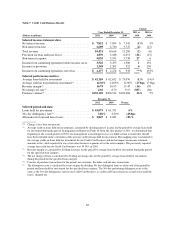
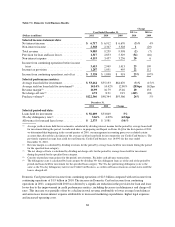
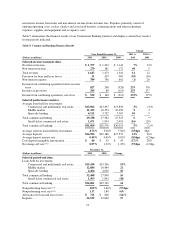
Table 7: Credit Card Business Results
Change
Year Ended December 31, 2011 vs. 2010 vs.
(Dollars in millions) 2011 2010 2009 2010 2009
Selected income statement data:
Net interest income ............................... $ 7,822 $ 7,894 $ 7,542 (1)% 5%
Non-interest income .............................. 2,609 2,720 3,747 (4) (27)
Total revenue ................................... 10,431 10,614 11,289 (2) (6)
Provision for loan and lease losses ................... 1,870 3,188 6,051 (41) (47)
Non-interest expense ............................. 5,035 3,951 3,738 27 6
Income from continuing operations before income taxes 3,526 3,475 1,500 1132
Income tax provision ............................. 1,249 1,201 522 4130
Income from continuing operations, net of tax ......... $ 2,277 $ 2,274 $ 978 **% 133%
Selected performance metrics:
Average loans held for investment ................... $ 62,110 $ 62,632 $ 73,076 (1)% (14)%
Average yield on loans held for investment(1) .......... 14.36% 14.63% 12.90% (27)bps 173bps
Revenue margin(2) ............................... 16.79 16.95 15.45 (16) 150
Net charge-off rate(3) .............................. 4.92 8.79 9.15 (387) (36)
Purchase volume(4) ............................... $135,120 $106,912 $102,068 26% 5%
December 31,
2011 2010 Change
Selected period-end data:
Loans held for investment ......................... $ 65,075 $ 61,371 6%
30+ day delinquency rate(5) ......................... 3.86% 4.29% (43)bps
Allowance for loan and lease losses .................. $ 2,847 $ 4,041 (30)%
** Change is less than one percent.
(1) Average yield on loans held for investment is calculated by dividing interest income for the period by average loans held
for investment during the period. In preparing our Report on Form 10-Q for the first quarter of 2011, we determined that
beginning in the second quarter of 2010, our management accounting processes excluded certain accounts that should
have been included in the calculation of the average yield on loans held for investment. The mapping error was limited to
the average yields on loans held for investment for our Credit Card business and had no impact on income statement
amounts or the yields reported for any of our other business segments or for the total company. The previously reported
average loan yield for our Credit Card business was 14.36% in 2010.
(2) Revenue margin is calculated by dividing revenues for the period by average loans held for investment during the period
for the specified loan category.
(3) The net charge-off rate is calculated by dividing net charge-offs for the period by average loans held for investment
during the period for the specified loan category.
(4) Consists of purchase transactions for the period, net of returns. Excludes cash advance transactions.
(5) The delinquency rate is calculated by loan category by dividing 30+ day delinquent loans as of the end of the period by
period-end loans held for investment for the specified loan category. The 30+ day performing delinquency rate is the
same as the 30+ day delinquency rate for our Credit Card business, as credit card loans remain on accrual status until the
loan is charged-off.
65
. .