Capital One 2011 Annual Report Download - page 124
Download and view the complete annual report
Please find page 124 of the 2011 Capital One annual report below. You can navigate through the pages in the report by either clicking on the pages listed below, or by using the keyword search tool below to find specific information within the annual report.-
 1
1 -
2
-
3
-
4
-
5
-
6
-
7
-
8
-
9
-
10
-
11
-
12
-
13
-
14
-
15
-
16
-
17
-
18
-
19
-
20
-
21
-
22
-
23
-
24
-
25
-
26
-
27
-
28
-
29
-
30
-
31
-
32
-
33
-
34
-
35
-
36
-
37
-
38
-
39
-
40
-
41
-
42
-
43
-
44
-
45
-
46
-
47
-
48
-
49
-
50
-
51
-
52
-
53
-
54
-
55
-
56
-
57
-
58
-
59
-
60
-
61
-
62
-
63
-
64
-
65
-
66
-
67
-
68
-
69
-
70
-
71
-
72
-
73
-
74
-
75
-
76
-
77
-
78
-
79
-
80
-
81
-
82
-
83
-
84
-
85
-
86
-
87
-
88
-
89
-
90
-
91
-
92
-
93
-
94
-
95
-
96
-
97
-
98
-
99
-
100
-
101
-
102
-
103
-
104
-
105
-
106
-
107
-
108
-
109
-
110
-
111
-
112
-
113
-
 114
114 -
 115
115 -
 116
116 -
 117
117 -
 118
118 -
 119
119 -
 120
120 -
 121
121 -
 122
122 -
 123
123 -
 124
124 -
 125
125 -
 126
126 -
 127
127 -
 128
128 -
 129
129 -
 130
130 -
 131
131 -
 132
132 -
 133
133 -
 134
134 -
135
-
136
-
137
-
138
-
139
-
140
-
141
-
142
-
143
-
144
-
145
-
146
-
147
-
148
-
149
-
150
-
151
-
152
-
153
-
154
-
155
-
156
-
157
-
158
-
159
-
160
-
161
-
162
-
163
-
164
-
165
-
166
-
167
-
168
-
169
-
170
-
171
-
172
-
173
-
174
-
175
-
176
-
177
-
178
-
179
-
180
-
181
-
182
-
183
-
184
-
185
-
186
-
187
-
188
-
189
-
190
-
191
-
192
-
193
-
194
-
195
-
196
-
197
-
198
-
199
-
200
-
201
-
202
-
203
-
204
-
205
-
206
-
207
-
208
-
209
-
210
-
211
-
212
-
213
-
214
-
215
-
216
-
217
-
218
-
219
-
220
-
221
-
222
-
223
-
224
-
225
-
226
-
227
-
228
-
229
-
230
-
231
-
232
-
233
-
234
-
235
-
236
-
237
-
238
-
239
-
240
-
241
-
242
-
243
-
244
-
245
-
246
-
247
-
248
-
249
-
250
-
251
-
252
-
253
-
254
-
255
-
256
-
257
-
258
-
259
-
260
-
261
-
262
-
263
-
264
-
265
-
266
-
267
-
268
-
269
-
270
-
271
-
272
-
273
-
274
-
275
-
276
-
277
-
278
-
279
-
280
-
281
-
282
-
283
-
284
-
285
-
286
-
287
-
288
-
289
-
290
-
291
-
292
-
293
-
294
-
295
-
296
-
297
-
298
 |
 |

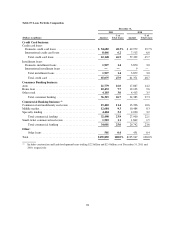
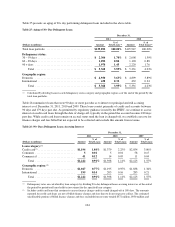
Table 25 presents an aging of 30+ day performing delinquent loans included in the above table.
Table 25: Aging of 30+ Day Delinquent Loans
December 31,
2011 2010
(Dollars in millions) Amount
% of
Total Loans(1) Amount
% of
Total Loans(1)
Total loan portfolio ................................ $135,892 100.00% $125,947 100.00%
Delinquency status:
30 – 59 days ...................................... $ 2,306 1.70% $ 2,008 1.59%
60 – 89 days ...................................... 1,092 0.80 1,103 0.88
90 + days ........................................ 1,970 1.45 2,220 1.76
Total ........................................ $ 5,368 3.95% $ 5,331 4.23%
Geographic region:
Domestic ........................................ $ 4,930 3.63% $ 4,899 3.89%
International ...................................... 438 0.32 432 0.34
Total ........................................ $ 5,368 3.95% $ 5,331 4.23%
(1) Calculated by dividing loans in each delinquency status category and geographic region as of the end of the period by the
total loan portfolio.
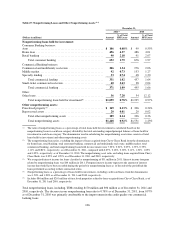
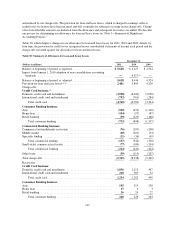
Table 26 summarizes loans that were 90 days or more past due as to interest or principal and still accruing
interest as of December 31, 2011, 2010 and 2009. These loans consist primarily of credit card accounts between
90 days and 179 days past due. As permitted by regulatory guidance issued by the FFIEC, we continue to accrue
interest on credit card loans through the date of charge-off, typically in the period the account becomes 180 days
past due. While credit card loans remain on accrual status until the loan is charged-off, we establish a reserve for
finance charges and fees billed but not expected to be collected and exclude this amount from revenue.
Table 26: 90+ Days Delinquent Loans Accruing Interest
December 31,
2011 2010 2009
(Dollars in millions) Amount
% of
Total Loans Amount
% of
Total Loans Amount
% of
Total Loans
Loan category:(1)
Credit card(2) .......................... $1,196 1.84% $1,379 2.25% $2,054 3.00%
Consumer ............................ 5 0.01 5 0.01 58 0.15
Commercial .......................... 41 0.12 14 0.05 11 0.04
Total ............................ $1,242 0.91% $1,398 1.11% $2,123 1.55%
Geographic region:(3)
Domestic ............................ $1,047 0.77% $1,195 0.95% $1,838 1.34%
International .......................... 195 0.14 203 0.16 285 0.21
Total ............................ $1,242 0.91% $1,398 1.11% $2,123 1.55%
(1) Delinquency rates are calculated by loan category by dividing 90+ day delinquent loans accruing interest as of the end of
the period by period-end loans held for investment for the specified loan category.
(2) Includes credit card loans that continue to accrue finance charges and fees until charged-off at 180 days. The amounts
reported for credit card loans are net of billed finance charges and fees that we do not expect to collect. The estimated
uncollectible portion of billed finance charges and fees excluded from revenue totaled $372 million, $950 million and
104