Capital One 2011 Annual Report Download - page 233
Download and view the complete annual report
Please find page 233 of the 2011 Capital One annual report below. You can navigate through the pages in the report by either clicking on the pages listed below, or by using the keyword search tool below to find specific information within the annual report.-
 1
1 -
2
-
3
-
4
-
5
-
6
-
7
-
8
-
9
-
10
-
11
-
12
-
13
-
14
-
15
-
16
-
17
-
18
-
19
-
20
-
21
-
22
-
23
-
24
-
25
-
26
-
27
-
28
-
29
-
30
-
31
-
32
-
33
-
34
-
35
-
36
-
37
-
38
-
39
-
40
-
41
-
42
-
43
-
44
-
45
-
46
-
47
-
48
-
49
-
50
-
51
-
52
-
53
-
54
-
55
-
56
-
57
-
58
-
59
-
60
-
61
-
62
-
63
-
64
-
65
-
66
-
67
-
68
-
69
-
70
-
71
-
72
-
73
-
74
-
75
-
76
-
77
-
78
-
79
-
80
-
81
-
82
-
83
-
84
-
85
-
86
-
87
-
88
-
89
-
90
-
91
-
92
-
93
-
94
-
95
-
96
-
97
-
98
-
99
-
100
-
101
-
102
-
103
-
104
-
105
-
106
-
107
-
108
-
109
-
110
-
111
-
112
-
113
-
114
-
115
-
116
-
117
-
118
-
119
-
120
-
121
-
122
-
123
-
124
-
125
-
126
-
127
-
128
-
129
-
130
-
131
-
132
-
133
-
134
-
135
-
136
-
137
-
138
-
139
-
140
-
141
-
142
-
143
-
144
-
145
-
146
-
147
-
148
-
149
-
150
-
151
-
152
-
153
-
154
-
155
-
156
-
157
-
158
-
159
-
160
-
161
-
162
-
163
-
164
-
165
-
166
-
167
-
168
-
169
-
170
-
171
-
172
-
173
-
174
-
175
-
176
-
177
-
178
-
179
-
180
-
181
-
182
-
183
-
184
-
185
-
186
-
187
-
188
-
189
-
190
-
191
-
192
-
193
-
194
-
195
-
196
-
197
-
198
-
199
-
200
-
201
-
202
-
203
-
204
-
205
-
206
-
207
-
208
-
209
-
210
-
211
-
212
-
213
-
214
-
215
-
216
-
217
-
218
-
219
-
220
-
221
-
222
-
 223
223 -
 224
224 -
 225
225 -
 226
226 -
 227
227 -
 228
228 -
 229
229 -
 230
230 -
 231
231 -
 232
232 -
 233
233 -
 234
234 -
 235
235 -
 236
236 -
 237
237 -
 238
238 -
 239
239 -
 240
240 -
 241
241 -
 242
242 -
 243
243 -
244
-
245
-
246
-
247
-
248
-
249
-
250
-
251
-
252
-
253
-
254
-
255
-
256
-
257
-
258
-
259
-
260
-
261
-
262
-
263
-
264
-
265
-
266
-
267
-
268
-
269
-
270
-
271
-
272
-
273
-
274
-
275
-
276
-
277
-
278
-
279
-
280
-
281
-
282
-
283
-
284
-
285
-
286
-
287
-
288
-
289
-
290
-
291
-
292
-
293
-
294
-
295
-
296
-
297
-
298
 |
 |

CAPITAL ONE FINANCIAL CORPORATION
NOTES TO CONSOLIDATED STATEMENTS—(Continued)
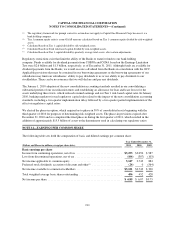
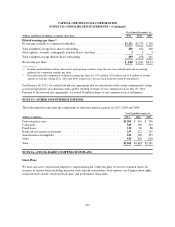
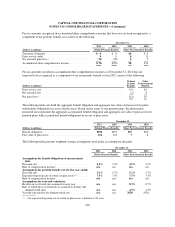
The following table provides the number of reserved common shares and the number of common shares available
for future issuance for our active stock-based compensation plan as of December 31, 2011, 2010 and 2009. The
ability to issue grants from the 1999 Non-Employee Directors Stock Incentive Plan was terminated in 2009.
Shares
Reserved
Available For Issuance
(In thousands) December 31
Plan Name 2011 2010 2009
2004 Stock Incentive Plan (“2004 Plan”) ........................... 40,000(1) 13,286 16,225 17,789
(1) On April 20, 2009 the Board authorized an increase in total shares reserved of 20 million shares to 40 million shares.
We issue new shares of common or treasury stock upon the settlement of employee stock-based incentive options
and awards.
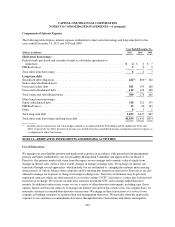
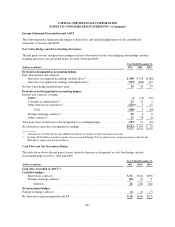
We recognize compensation expense on a straight-line basis over the entire award’s vesting period for any
awards with graded vesting attributes. Total compensation expense recognized for stock-based compensation
during the years 2011, 2010 and 2009 was $189 million, $149 million and $146 million, respectively. The total
income tax benefit recognized in the consolidated statement of income for stock-based compensation
arrangements during the years 2011, 2010 and 2009 was $66 million, $52 million and $51 million, respectively.
Stock Options
Generally, the exercise price of stock options will equal the fair market value of our common stock on the date of
grant. The maximum contractual term for options is ten years and option vesting is determined at the time of grant.
The vesting for most options is 33 1/3 percent per year beginning with the first anniversary of the grant date.
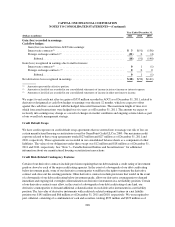
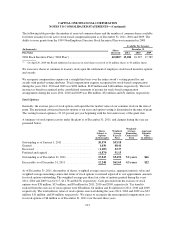
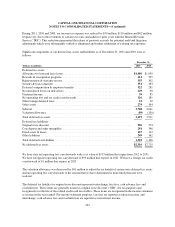
A summary of stock option activity under the plans as of December 31, 2011, and changes during the year are
presented below:
Shares
Subject to
Options
(in thousands)
Weighted-
Average
Exercise
Price
Weighted-
Average
Remaining
Contractual
Term
Aggregate
Intrinsic
Value
(in millions)
Outstanding as of January 1, 2011 ..................... 20,574 $53.18
Granted .......................................... 1,430 48.41
Exercised ........................................ (1,187) 32.37
Forfeited and expired ............................... (4,874) 51.15
Outstanding as of December 31, 2011 .................. 15,943 $54.92 5.2 years $66
Exercisable as of December 31, 2011 .................. 12,248 $61.65 4.3 years $22
As of December 31, 2011, the number of shares, weighted average exercise price, aggregate intrinsic value and
weighted average remaining contractual terms of stock options vested and expected to vest approximate amounts
for stock options outstanding. The weighted-average per share fair value of options granted during the years
2011, 2010 and 2009 was $13.17, $11.78 and $4.56, respectively. Cash proceeds from the exercise of stock
options were $38 million, $13 million, and $9 million for 2011, 2010 and 2009, respectively. Tax benefits
realized from the exercise of stock options were $8 million, $4 million and $1 million for 2011, 2010 and 2009,
respectively. The total intrinsic value of stock options exercised during the years 2011, 2010 and 2009 was $23
million, $11 million, and $4 million, respectively. We expect to recognize the unrecognized compensation cost
for stock options of $6 million as of December 31, 2011 over the next three years.
213