Capital One 2011 Annual Report Download - page 147
Download and view the complete annual report
Please find page 147 of the 2011 Capital One annual report below. You can navigate through the pages in the report by either clicking on the pages listed below, or by using the keyword search tool below to find specific information within the annual report.-
 1
1 -
2
-
3
-
4
-
5
-
6
-
7
-
8
-
9
-
10
-
11
-
12
-
13
-
14
-
15
-
16
-
17
-
18
-
19
-
20
-
21
-
22
-
23
-
24
-
25
-
26
-
27
-
28
-
29
-
30
-
31
-
32
-
33
-
34
-
35
-
36
-
37
-
38
-
39
-
40
-
41
-
42
-
43
-
44
-
45
-
46
-
47
-
48
-
49
-
50
-
51
-
52
-
53
-
54
-
55
-
56
-
57
-
58
-
59
-
60
-
61
-
62
-
63
-
64
-
65
-
66
-
67
-
68
-
69
-
70
-
71
-
72
-
73
-
74
-
75
-
76
-
77
-
78
-
79
-
80
-
81
-
82
-
83
-
84
-
85
-
86
-
87
-
88
-
89
-
90
-
91
-
92
-
93
-
94
-
95
-
96
-
97
-
98
-
99
-
100
-
101
-
102
-
103
-
104
-
105
-
106
-
107
-
108
-
109
-
110
-
111
-
112
-
113
-
114
-
115
-
116
-
117
-
118
-
119
-
120
-
121
-
122
-
123
-
124
-
125
-
126
-
127
-
128
-
129
-
130
-
131
-
132
-
133
-
134
-
135
-
136
-
 137
137 -
 138
138 -
 139
139 -
 140
140 -
 141
141 -
 142
142 -
 143
143 -
 144
144 -
 145
145 -
 146
146 -
 147
147 -
 148
148 -
 149
149 -
 150
150 -
 151
151 -
 152
152 -
 153
153 -
 154
154 -
 155
155 -
 156
156 -
 157
157 -
158
-
159
-
160
-
161
-
162
-
163
-
164
-
165
-
166
-
167
-
168
-
169
-
170
-
171
-
172
-
173
-
174
-
175
-
176
-
177
-
178
-
179
-
180
-
181
-
182
-
183
-
184
-
185
-
186
-
187
-
188
-
189
-
190
-
191
-
192
-
193
-
194
-
195
-
196
-
197
-
198
-
199
-
200
-
201
-
202
-
203
-
204
-
205
-
206
-
207
-
208
-
209
-
210
-
211
-
212
-
213
-
214
-
215
-
216
-
217
-
218
-
219
-
220
-
221
-
222
-
223
-
224
-
225
-
226
-
227
-
228
-
229
-
230
-
231
-
232
-
233
-
234
-
235
-
236
-
237
-
238
-
239
-
240
-
241
-
242
-
243
-
244
-
245
-
246
-
247
-
248
-
249
-
250
-
251
-
252
-
253
-
254
-
255
-
256
-
257
-
258
-
259
-
260
-
261
-
262
-
263
-
264
-
265
-
266
-
267
-
268
-
269
-
270
-
271
-
272
-
273
-
274
-
275
-
276
-
277
-
278
-
279
-
280
-
281
-
282
-
283
-
284
-
285
-
286
-
287
-
288
-
289
-
290
-
291
-
292
-
293
-
294
-
295
-
296
-
297
-
298
 |
 |

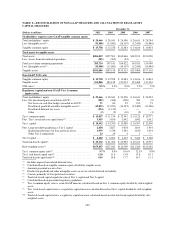
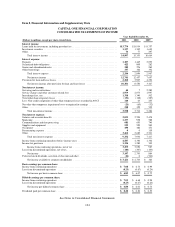
TABLE D—NET CHARGE-OFFS(1)
Year Ended December 31,
(Dollars in millions) 2011 2010 2009 2008 2007
Reported:
Average loans held for investment(2) .............. $128,424 $128,526 $ 99,787 $ 98,971 $ 93,542
Net charge-offs ............................... 3,771 6,651 4,568 3,478 1,961
Net charge-offs rate(3) ......................... 2.94% 5.18% 4.58% 3.51% 2.10%
Managed:
Average loans held for investment(2) .............. $128,424 $128,622 $143,514 $147,812 $144,727
Net charge-offs ............................... 3,771 6,657 8,421 6,425 4,162
Net charge-off rate(3) .......................... 2.94% 5.18% 5.87% 4.35% 2.88%
(1) Net charge-offs reflect charge-offs, net of recoveries, related to our total held-for-investment loan portfolio, which we
previously referred to as our “managed” loan portfolio. The total held-for-investment loan portfolio includes loans
recorded on our balance sheet and loans held in our securitization trusts.
(2) The average balances of the acquired Chevy Chase Bank loan portfolio, which are included in the total average loans
held for investment used in calculating the net charge-off rates, were $5.0 billion , $6.3 billion and $6.8 billion for 2011,
2010 and 2009, respectively.
(3) Calculated for each loan category by dividing net charge-offs for the period divided by average loans held for investment
during the period.
127