Capital One 2011 Annual Report Download - page 231
Download and view the complete annual report
Please find page 231 of the 2011 Capital One annual report below. You can navigate through the pages in the report by either clicking on the pages listed below, or by using the keyword search tool below to find specific information within the annual report.-
 1
1 -
2
-
3
-
4
-
5
-
6
-
7
-
8
-
9
-
10
-
11
-
12
-
13
-
14
-
15
-
16
-
17
-
18
-
19
-
20
-
21
-
22
-
23
-
24
-
25
-
26
-
27
-
28
-
29
-
30
-
31
-
32
-
33
-
34
-
35
-
36
-
37
-
38
-
39
-
40
-
41
-
42
-
43
-
44
-
45
-
46
-
47
-
48
-
49
-
50
-
51
-
52
-
53
-
54
-
55
-
56
-
57
-
58
-
59
-
60
-
61
-
62
-
63
-
64
-
65
-
66
-
67
-
68
-
69
-
70
-
71
-
72
-
73
-
74
-
75
-
76
-
77
-
78
-
79
-
80
-
81
-
82
-
83
-
84
-
85
-
86
-
87
-
88
-
89
-
90
-
91
-
92
-
93
-
94
-
95
-
96
-
97
-
98
-
99
-
100
-
101
-
102
-
103
-
104
-
105
-
106
-
107
-
108
-
109
-
110
-
111
-
112
-
113
-
114
-
115
-
116
-
117
-
118
-
119
-
120
-
121
-
122
-
123
-
124
-
125
-
126
-
127
-
128
-
129
-
130
-
131
-
132
-
133
-
134
-
135
-
136
-
137
-
138
-
139
-
140
-
141
-
142
-
143
-
144
-
145
-
146
-
147
-
148
-
149
-
150
-
151
-
152
-
153
-
154
-
155
-
156
-
157
-
158
-
159
-
160
-
161
-
162
-
163
-
164
-
165
-
166
-
167
-
168
-
169
-
170
-
171
-
172
-
173
-
174
-
175
-
176
-
177
-
178
-
179
-
180
-
181
-
182
-
183
-
184
-
185
-
186
-
187
-
188
-
189
-
190
-
191
-
192
-
193
-
194
-
195
-
196
-
197
-
198
-
199
-
200
-
201
-
202
-
203
-
204
-
205
-
206
-
207
-
208
-
209
-
210
-
211
-
212
-
213
-
214
-
215
-
216
-
217
-
218
-
219
-
220
-
 221
221 -
 222
222 -
 223
223 -
 224
224 -
 225
225 -
 226
226 -
 227
227 -
 228
228 -
 229
229 -
 230
230 -
 231
231 -
 232
232 -
 233
233 -
 234
234 -
 235
235 -
 236
236 -
 237
237 -
 238
238 -
 239
239 -
 240
240 -
 241
241 -
242
-
243
-
244
-
245
-
246
-
247
-
248
-
249
-
250
-
251
-
252
-
253
-
254
-
255
-
256
-
257
-
258
-
259
-
260
-
261
-
262
-
263
-
264
-
265
-
266
-
267
-
268
-
269
-
270
-
271
-
272
-
273
-
274
-
275
-
276
-
277
-
278
-
279
-
280
-
281
-
282
-
283
-
284
-
285
-
286
-
287
-
288
-
289
-
290
-
291
-
292
-
293
-
294
-
295
-
296
-
297
-
298
 |
 |

CAPITAL ONE FINANCIAL CORPORATION
NOTES TO CONSOLIDATED STATEMENTS—(Continued)
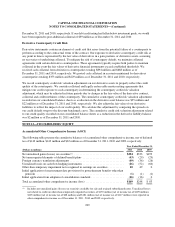
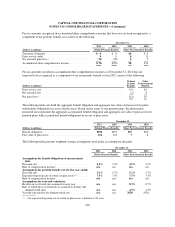
(2) The regulatory framework for prompt corrective action does not apply to Capital One Financial Corp. because it is a
bank holding company.
(3) Tier 1 common equity ratio is a non-GAAP measure calculated based on Tier 1 common equity divided by risk-weighted
assets.
(4) Calculated based on Tier 1 capital divided by risk-weighted assets.
(5) Calculated based on Total risk-based capital divided by risk-weighted assets.
(6) Calculated based on Tier 1 capital divided by quarterly average total assets, after certain adjustments.
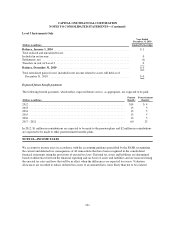
Regulatory restrictions exist that limit the ability of the Banks to transfer funds to our bank holding
company. Funds available for dividend payments from COBNA and CONA based on the Earnings Limitation
Test were $2.6 billion and $1.3 billion, respectively, as of December 31, 2011. Although funds are available for
dividend payments from the Banks, we would execute a dividend from the Banks in consultation with the OCC.
Applicable provisions that may be contained in our borrowing agreements or the borrowing agreements of our
subsidiaries may limit our subsidiaries’ ability to pay dividends to us or our ability to pay dividends to our
stockholders. There can be no assurance that we will declare and pay any dividends.
The January 1, 2010 adoption of the new consolidation accounting standards resulted in our consolidating a
substantial portion of our securitization trusts and establishing an allowance for loan and lease losses for the
assets underlying these trusts, which reduced retained earnings and our Tier 1 risk-based capital ratio. In January
2010, banking regulators issued regulatory capital rules related to the impact of the new consolidation accounting
standards, including a two-quarter implementation delay followed by a two-quarter partial implementation of the
effect on regulatory capital ratios.
We elected the phase-in option, which required us to phase-in 50% of consolidated assets beginning with the
third quarter of 2010 for purposes of determining risk-weighted assets. The phase-in provisions expired after
December 31, 2010 and we completed the final phase-in during the first quarter of 2011, which resulted in the
addition of approximately $15.5 billion of assets to the denominator used in calculating our regulatory ratios.
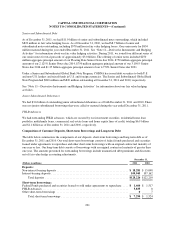
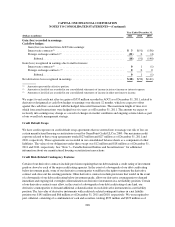
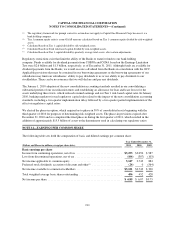
NOTE 14—EARNINGS PER COMMON SHARE
The following table sets forth the computation of basic and diluted earnings per common share:
Year Ended December 31,
(Dollars and Shares in millions, except per share data) 2011 2010 2009
Basic earnings per share
Income from continuing operations, net of tax ................................ $3,253 $3,050 $ 987
Loss from discontinued operations, net of tax ................................. (106) (307) (103)
Net income applicable to common equity .................................... 3,147 2,743 884
Preferred stock dividends, accretion of discount and other(1) ..................... (26) 0 (564)
Net income available to common stockholders ................................ $3,121 $2,743 $ 320
Total weighted-average basic shares outstanding .............................. 456 452 428
Net income per share .................................................... $ 6.85 $ 6.07 $0.75
211