Capital One 2011 Annual Report Download - page 212
Download and view the complete annual report
Please find page 212 of the 2011 Capital One annual report below. You can navigate through the pages in the report by either clicking on the pages listed below, or by using the keyword search tool below to find specific information within the annual report.-
 1
1 -
2
-
3
-
4
-
5
-
6
-
7
-
8
-
9
-
10
-
11
-
12
-
13
-
14
-
15
-
16
-
17
-
18
-
19
-
20
-
21
-
22
-
23
-
24
-
25
-
26
-
27
-
28
-
29
-
30
-
31
-
32
-
33
-
34
-
35
-
36
-
37
-
38
-
39
-
40
-
41
-
42
-
43
-
44
-
45
-
46
-
47
-
48
-
49
-
50
-
51
-
52
-
53
-
54
-
55
-
56
-
57
-
58
-
59
-
60
-
61
-
62
-
63
-
64
-
65
-
66
-
67
-
68
-
69
-
70
-
71
-
72
-
73
-
74
-
75
-
76
-
77
-
78
-
79
-
80
-
81
-
82
-
83
-
84
-
85
-
86
-
87
-
88
-
89
-
90
-
91
-
92
-
93
-
94
-
95
-
96
-
97
-
98
-
99
-
100
-
101
-
102
-
103
-
104
-
105
-
106
-
107
-
108
-
109
-
110
-
111
-
112
-
113
-
114
-
115
-
116
-
117
-
118
-
119
-
120
-
121
-
122
-
123
-
124
-
125
-
126
-
127
-
128
-
129
-
130
-
131
-
132
-
133
-
134
-
135
-
136
-
137
-
138
-
139
-
140
-
141
-
142
-
143
-
144
-
145
-
146
-
147
-
148
-
149
-
150
-
151
-
152
-
153
-
154
-
155
-
156
-
157
-
158
-
159
-
160
-
161
-
162
-
163
-
164
-
165
-
166
-
167
-
168
-
169
-
170
-
171
-
172
-
173
-
174
-
175
-
176
-
177
-
178
-
179
-
180
-
181
-
182
-
183
-
184
-
185
-
186
-
187
-
188
-
189
-
190
-
191
-
192
-
193
-
194
-
195
-
196
-
197
-
198
-
199
-
200
-
201
-
 202
202 -
 203
203 -
 204
204 -
 205
205 -
 206
206 -
 207
207 -
 208
208 -
 209
209 -
 210
210 -
 211
211 -
 212
212 -
 213
213 -
 214
214 -
 215
215 -
 216
216 -
 217
217 -
 218
218 -
 219
219 -
 220
220 -
 221
221 -
 222
222 -
223
-
224
-
225
-
226
-
227
-
228
-
229
-
230
-
231
-
232
-
233
-
234
-
235
-
236
-
237
-
238
-
239
-
240
-
241
-
242
-
243
-
244
-
245
-
246
-
247
-
248
-
249
-
250
-
251
-
252
-
253
-
254
-
255
-
256
-
257
-
258
-
259
-
260
-
261
-
262
-
263
-
264
-
265
-
266
-
267
-
268
-
269
-
270
-
271
-
272
-
273
-
274
-
275
-
276
-
277
-
278
-
279
-
280
-
281
-
282
-
283
-
284
-
285
-
286
-
287
-
288
-
289
-
290
-
291
-
292
-
293
-
294
-
295
-
296
-
297
-
298
 |
 |

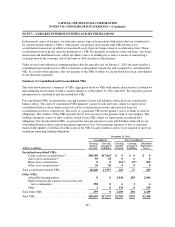
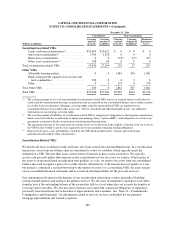
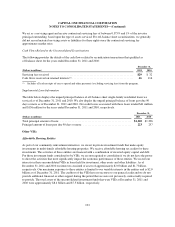
CAPITAL ONE FINANCIAL CORPORATION
NOTES TO CONSOLIDATED STATEMENTS—(Continued)
The changes in the fair value of retained interests are primarily driven by rate assumption changes and volume
fluctuations. All of these retained residual interests are subject to loss in the event assumptions used to determine
the estimated fair value do not prevail, or if borrowers default on the related securitized receivables and our
retained subordinated tranches are used to repay investors. See the table below for key assumptions and
sensitivities for retained interest valuations.
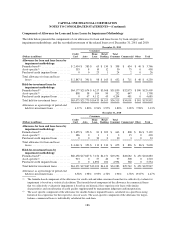
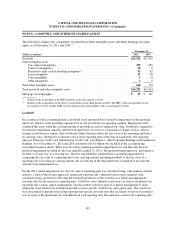
Key Assumptions and Sensitivities for Retained Interest Valuations
The key assumptions used in determining the fair value of the interest-only strip and other retained residual
interests include the weighted average ranges for principal payment rates, lives of receivables and discount rates,
all of which are included in the following table. The principal repayment rate assumptions were determined using
actual and forecast trust principal payment rates based on the collateral. The lives of receivables were determined
as the number of months necessary to repay the investors given the principal payment rate assumptions. The
discount rates were determined using primarily trust specific statistics and forward rate curves, and were
reflective of what market participants would use in a similar valuation. Additionally, accrued interest receivable,
cash reserve and spread accounts were discounted over the estimated life of the assets.
If these assumptions are not met, or if they change, the interest-only strip, retained interests and related servicing
and securitizations income would be affected. The following adverse changes to the key assumptions and
estimates are hypothetical and should be used with caution. As the figures indicate, any change in fair value
based on a 10% or 20% variation in assumptions cannot be extrapolated because the relationship of a change in
assumption to the change in fair value may not be linear. Also, the effect of a variation in a particular assumption
on the fair value of the interest-only strip is calculated independently from any change in another assumption.
However, changes in one factor may result in changes in other factors, which might magnify or counteract the
sensitivities.
For the periods ending December 31, 2011 and 2010, the assumptions and sensitivities shown below include all
off-balance sheet securitizations:
December 31,
(Dollars in millions) 2011 2010
Interest-only strip retained interests ..................................... $ 110(1) $ 136(1)
Weighted average life for receivables (months) ............................ 70 60
Principal repayment rate (weighted average rate) .......................... 12.2 - 17.1% 16.3 - 18.1%
Impact on fair value of 10% adverse change .............................. $ 15 $2
Impact on fair value of 20% adverse change .............................. (5) (6)
Discount rate (weighted average rate) ................................... 25.0 - 42.2% 25.2 - 42.2%
Impact on fair value of 10% adverse change .............................. $ (7) $ (7)
Impact on fair value of 20% adverse change .............................. (13) (14)
(1) Does not include liquidity swap related to the negative amortization bonds of $(16) million and $(19) million as of
December 31, 2011 and 2010, respectively.
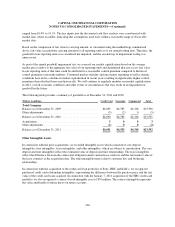
Static pool credit losses were calculated by summing the actual and projected future credit losses and dividing
them by the original balance of each pool of assets. Due to the short-term revolving nature of the loan
receivables, the weighted average percentage of static pool credit losses was not considered materially different
from the assumed charge-off rates used to determine the fair value of the retained interests.
192