Capital One 2011 Annual Report Download - page 123
Download and view the complete annual report
Please find page 123 of the 2011 Capital One annual report below. You can navigate through the pages in the report by either clicking on the pages listed below, or by using the keyword search tool below to find specific information within the annual report.-
 1
1 -
2
-
3
-
4
-
5
-
6
-
7
-
8
-
9
-
10
-
11
-
12
-
13
-
14
-
15
-
16
-
17
-
18
-
19
-
20
-
21
-
22
-
23
-
24
-
25
-
26
-
27
-
28
-
29
-
30
-
31
-
32
-
33
-
34
-
35
-
36
-
37
-
38
-
39
-
40
-
41
-
42
-
43
-
44
-
45
-
46
-
47
-
48
-
49
-
50
-
51
-
52
-
53
-
54
-
55
-
56
-
57
-
58
-
59
-
60
-
61
-
62
-
63
-
64
-
65
-
66
-
67
-
68
-
69
-
70
-
71
-
72
-
73
-
74
-
75
-
76
-
77
-
78
-
79
-
80
-
81
-
82
-
83
-
84
-
85
-
86
-
87
-
88
-
89
-
90
-
91
-
92
-
93
-
94
-
95
-
96
-
97
-
98
-
99
-
100
-
101
-
102
-
103
-
104
-
105
-
106
-
107
-
108
-
109
-
110
-
111
-
112
-
 113
113 -
 114
114 -
 115
115 -
 116
116 -
 117
117 -
 118
118 -
 119
119 -
 120
120 -
 121
121 -
 122
122 -
 123
123 -
 124
124 -
 125
125 -
 126
126 -
 127
127 -
 128
128 -
 129
129 -
 130
130 -
 131
131 -
 132
132 -
 133
133 -
134
-
135
-
136
-
137
-
138
-
139
-
140
-
141
-
142
-
143
-
144
-
145
-
146
-
147
-
148
-
149
-
150
-
151
-
152
-
153
-
154
-
155
-
156
-
157
-
158
-
159
-
160
-
161
-
162
-
163
-
164
-
165
-
166
-
167
-
168
-
169
-
170
-
171
-
172
-
173
-
174
-
175
-
176
-
177
-
178
-
179
-
180
-
181
-
182
-
183
-
184
-
185
-
186
-
187
-
188
-
189
-
190
-
191
-
192
-
193
-
194
-
195
-
196
-
197
-
198
-
199
-
200
-
201
-
202
-
203
-
204
-
205
-
206
-
207
-
208
-
209
-
210
-
211
-
212
-
213
-
214
-
215
-
216
-
217
-
218
-
219
-
220
-
221
-
222
-
223
-
224
-
225
-
226
-
227
-
228
-
229
-
230
-
231
-
232
-
233
-
234
-
235
-
236
-
237
-
238
-
239
-
240
-
241
-
242
-
243
-
244
-
245
-
246
-
247
-
248
-
249
-
250
-
251
-
252
-
253
-
254
-
255
-
256
-
257
-
258
-
259
-
260
-
261
-
262
-
263
-
264
-
265
-
266
-
267
-
268
-
269
-
270
-
271
-
272
-
273
-
274
-
275
-
276
-
277
-
278
-
279
-
280
-
281
-
282
-
283
-
284
-
285
-
286
-
287
-
288
-
289
-
290
-
291
-
292
-
293
-
294
-
295
-
296
-
297
-
298
 |
 |

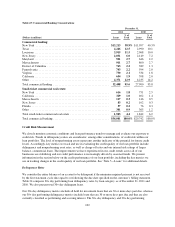
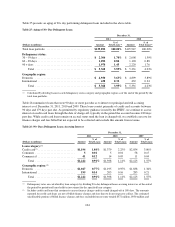
delinquency metrics are the same for credit card loans, as we continue to classify credit card loans as performing
until they are charged-off, generally when the loan is 180 days past due. However, the 30+ day delinquency and
30+ day performing delinquency metrics differ for other loan categories based on our policies for classifying
loans as nonperforming. See “Note 5—Loans” for additional information on our policies for classifying loans as
nonperforming and for charging-off loans.
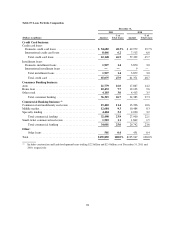
The delinquency rates presented are calculated, by loan category, based on our total loan portfolio. Our total loan
portfolio consists of loans recorded on our balance sheet, which includes purchased credit-impaired (“PCI”)
loans acquired from Chevy Chase Bank and loans held in our securitization trusts. Loans acquired from Chevy
Chase Bank were recorded at fair value at acquisition. We separately track and report the performance of PCI
loans and exclude these loans from the numerator in calculating our net charge-off, delinquency, nonperforming
loan and nonperforming asset rates.
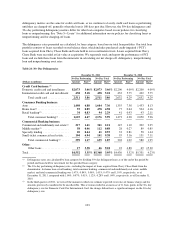
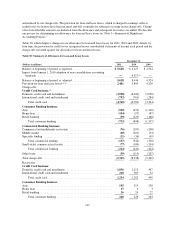
Table 24: 30+ Day Delinquencies
December 31, 2011 December 31, 2010
30+ Day Performing 30+ Day Total 30+ Day Performing 30+ Day Total
(Dollars in millions) Amount Rate(1) Amount Rate(1) Amount Rate(1) Amount Rate(1)
Credit Card business:(3)
Domestic credit card and installment . . $2,073 3.66% $2,073 3.66% $2,200 4.09% $2,200 4.09%
International credit card and installment 438 5.18 438 5.18 432 5.75 432 5.75
Total credit card ............... 2,511 3.86 2,511 3.86 2,632 4.29 2,632 4.29
Consumer Banking business:
Auto ............................ 1,498 6.88 1,604 7.36 1,355 7.58 1,453 8.13
Home loan(2) ...................... 93 0.89 478 4.58 77 0.64 504 4.16
Retail banking(2) ................... 34 0.83 94 2.29 41 0.93 93 2.11
Total consumer banking(2) ....... 1,625 4.47 2,176 5.99 1,473 4.28 2,050 5.96
Commercial Banking business:
Commercial and multifamily real estate 217 1.41 341 2.21 147 1.10 302 2.25
Middle market(2) .................. 58 0.46 112 0.88 28 0.27 89 0.85
Specialty lending .................. 20 0.44 41 0.93 33 0.81 58 1.44
Small-ticket commercial real estate .... 104 6.94 141 9.38 95 5.16 131 7.11
Total commercial banking(2) ..... 399 1.17 635 1.87 303 1.02 580 1.95
Other:
Other loans ................... 17 3.38 46 9.18 22 4.88 69 15.30
Total ............................ $4,552 3.35% $5,368 3.95% $4,430 3.52% $5,331 4.23%
(1) Delinquency rates are calculated by loan category by dividing 30+ day delinquent loans as of the end of the period by
period-end loans held for investment for the specified loan category.
(2) The 30+ day performing delinquency rate, excluding the impact of loans acquired from Chevy Chase Bank from the
denominator, for home loan, retail banking, total consumer banking, commercial and multifamily real estate, middle
market, and total commercial banking was 1.47%, 0.84%, 5.06%, 1.43%, 0.47% and 1.19%, respectively, as of
December 31, 2011, compared with 1.06%, 0.97%, 5.01%, 1.12%, 0.28% and 1.04%, respectively, as of December 31,
2010.
(3) In the third quarter of 2011, we revised the manner in which we estimate expected recoveries of finance charge and fee
amounts previously considered to be uncollectible. This revision resulted in an increase of 11 basis points in the 30+ day
delinquency rate for Domestic Card. For International Card, the change did not have a significant impact on the 30+ day
delinquency rate.
103
(2)