Capital One 2011 Annual Report Download - page 98
Download and view the complete annual report
Please find page 98 of the 2011 Capital One annual report below. You can navigate through the pages in the report by either clicking on the pages listed below, or by using the keyword search tool below to find specific information within the annual report.-
 1
1 -
2
-
3
-
4
-
5
-
6
-
7
-
8
-
9
-
10
-
11
-
12
-
13
-
14
-
15
-
16
-
17
-
18
-
19
-
20
-
21
-
22
-
23
-
24
-
25
-
26
-
27
-
28
-
29
-
30
-
31
-
32
-
33
-
34
-
35
-
36
-
37
-
38
-
39
-
40
-
41
-
42
-
43
-
44
-
45
-
46
-
47
-
48
-
49
-
50
-
51
-
52
-
53
-
54
-
55
-
56
-
57
-
58
-
59
-
60
-
61
-
62
-
63
-
64
-
65
-
66
-
67
-
68
-
69
-
70
-
71
-
72
-
73
-
74
-
75
-
76
-
77
-
78
-
79
-
80
-
81
-
82
-
83
-
84
-
85
-
86
-
87
-
 88
88 -
 89
89 -
 90
90 -
 91
91 -
 92
92 -
 93
93 -
 94
94 -
 95
95 -
 96
96 -
 97
97 -
 98
98 -
 99
99 -
 100
100 -
 101
101 -
 102
102 -
 103
103 -
 104
104 -
 105
105 -
 106
106 -
 107
107 -
 108
108 -
109
-
110
-
111
-
112
-
113
-
114
-
115
-
116
-
117
-
118
-
119
-
120
-
121
-
122
-
123
-
124
-
125
-
126
-
127
-
128
-
129
-
130
-
131
-
132
-
133
-
134
-
135
-
136
-
137
-
138
-
139
-
140
-
141
-
142
-
143
-
144
-
145
-
146
-
147
-
148
-
149
-
150
-
151
-
152
-
153
-
154
-
155
-
156
-
157
-
158
-
159
-
160
-
161
-
162
-
163
-
164
-
165
-
166
-
167
-
168
-
169
-
170
-
171
-
172
-
173
-
174
-
175
-
176
-
177
-
178
-
179
-
180
-
181
-
182
-
183
-
184
-
185
-
186
-
187
-
188
-
189
-
190
-
191
-
192
-
193
-
194
-
195
-
196
-
197
-
198
-
199
-
200
-
201
-
202
-
203
-
204
-
205
-
206
-
207
-
208
-
209
-
210
-
211
-
212
-
213
-
214
-
215
-
216
-
217
-
218
-
219
-
220
-
221
-
222
-
223
-
224
-
225
-
226
-
227
-
228
-
229
-
230
-
231
-
232
-
233
-
234
-
235
-
236
-
237
-
238
-
239
-
240
-
241
-
242
-
243
-
244
-
245
-
246
-
247
-
248
-
249
-
250
-
251
-
252
-
253
-
254
-
255
-
256
-
257
-
258
-
259
-
260
-
261
-
262
-
263
-
264
-
265
-
266
-
267
-
268
-
269
-
270
-
271
-
272
-
273
-
274
-
275
-
276
-
277
-
278
-
279
-
280
-
281
-
282
-
283
-
284
-
285
-
286
-
287
-
288
-
289
-
290
-
291
-
292
-
293
-
294
-
295
-
296
-
297
-
298
 |
 |
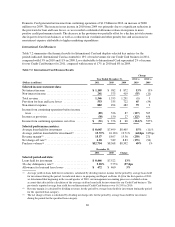
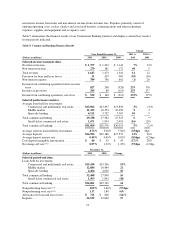
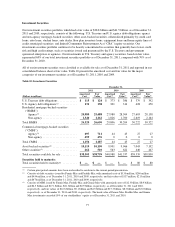
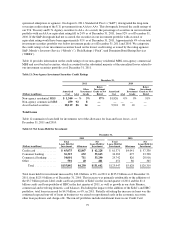
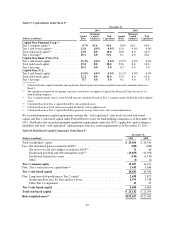
(4) Consists of securities collateralized by credit card loans, auto loans, auto dealer floor plan inventory loans and leases,
student loans, equipment loans, and other. The distribution among these asset types was approximately 75% credit card
loans, 11% auto dealer floor plan inventory loans and leases, 6% auto loans, 4% student loans, 2% equipment loans, and
2% other as of December 31, 2011. In comparison, the distribution was approximately 78 % credit card loans, 7%
student loans, 7% auto loans, 6% auto dealer floor plan inventory loans and leases, and 2% equipment loans as of
December 31, 2010. Approximately 86% of the securities in our asset-backed security portfolio were rated AAA or its
equivalent as of December 31, 2011, compared with 90% as of December 31, 2010.
(5) Consists of municipal securities and equity investments, primarily related to CRA activities.
(6) Consists of negative amortization mortgage-backed securities.
We sold approximately $9.2 billion of investment securities, consisting predominantly of agency MBS, in 2011.
We recorded a gain of $259 million on the sale of these securities. We provide additional information in “Market
Risk Profile.”
Unrealized gains and losses on our available-for-sale securities are recorded net of tax as a component of
accumulated other comprehensive income (“AOCI”). We had gross unrealized gains of $683 million and gross
unrealized losses of $227 million on available-for sale securities as of December 31, 2011, compared with gross
unrealized gains of $830 million and gross unrealized losses of $281 million on available-for sale securities as of
December 31, 2010. The decrease in gross unrealized losses in 2011 was primarily driven by a tightening of
credit spreads, attributable to the improvement in credit performance and increased liquidity, and lower interest
rates. The substantial majority of the gross unrealized losses as of December 31, 2011 and 2010 related to
non-agency residential MBS. Of the $227 million gross unrealized losses as of December 31, 2011, $169 million
related to securities that had been in a loss position for more than 12 months.
We evaluate available-for-sale securities in an unrealized loss position as of the end of each quarter for other-
than-temporary impairment based on a number of criteria, including the extent and duration of the decline in
value, the severity and duration of the impairment, recent events specific to the issuer and/or industry to which
the issuer belongs, the payment structure of the security, external credit ratings, the failure of the issuer to make
scheduled interest or principal payments, the value of underlying collateral, our intent and ability to hold the
security and current market conditions.
Other-than-temporary impairment (“OTTI”) is recognized in earnings if one of the following conditions exists:
(1) a decision to sell the security has been made; (2) it is more likely than not that we will be required to sell the
security before the impairment is recovered; or (3) the amortized cost basis is not expected to be recovered. If,
however, we have not made a decision to sell the security and we do not expect that we will be required to sell
prior to recovery of the amortized cost basis, only the credit component of other-than-temporary impairment is
recognized in earnings. The noncredit component is recorded in AOCI. The credit component is the difference
between the security’s amortized cost basis and the present value of its expected future cash flows discounted
based on the original yield, while the noncredit component is the remaining difference between the security’s fair
value and amortized cost.
We recognized net OTTI on debt securities of $21 million, $65 million and $32 million in 2011, 2010 and 2009,
respectively, due in part to deterioration in the credit performance of certain securities resulting from the
continued weaknesses in the housing market, high unemployment, and our decision to sell certain other securities
before recovery of the impairment amount.
We provide additional information on our available-for-sale securities in “Note 4—Investment Securities.”
Credit Ratings
Our investment securities portfolio continues to be heavily concentrated in securities that generally have lower
credit risk and high credit ratings, such as securities issued and guaranteed by the U.S. Treasury and government
78