Capital One 2011 Annual Report Download - page 218
Download and view the complete annual report
Please find page 218 of the 2011 Capital One annual report below. You can navigate through the pages in the report by either clicking on the pages listed below, or by using the keyword search tool below to find specific information within the annual report.-
 1
1 -
2
-
3
-
4
-
5
-
6
-
7
-
8
-
9
-
10
-
11
-
12
-
13
-
14
-
15
-
16
-
17
-
18
-
19
-
20
-
21
-
22
-
23
-
24
-
25
-
26
-
27
-
28
-
29
-
30
-
31
-
32
-
33
-
34
-
35
-
36
-
37
-
38
-
39
-
40
-
41
-
42
-
43
-
44
-
45
-
46
-
47
-
48
-
49
-
50
-
51
-
52
-
53
-
54
-
55
-
56
-
57
-
58
-
59
-
60
-
61
-
62
-
63
-
64
-
65
-
66
-
67
-
68
-
69
-
70
-
71
-
72
-
73
-
74
-
75
-
76
-
77
-
78
-
79
-
80
-
81
-
82
-
83
-
84
-
85
-
86
-
87
-
88
-
89
-
90
-
91
-
92
-
93
-
94
-
95
-
96
-
97
-
98
-
99
-
100
-
101
-
102
-
103
-
104
-
105
-
106
-
107
-
108
-
109
-
110
-
111
-
112
-
113
-
114
-
115
-
116
-
117
-
118
-
119
-
120
-
121
-
122
-
123
-
124
-
125
-
126
-
127
-
128
-
129
-
130
-
131
-
132
-
133
-
134
-
135
-
136
-
137
-
138
-
139
-
140
-
141
-
142
-
143
-
144
-
145
-
146
-
147
-
148
-
149
-
150
-
151
-
152
-
153
-
154
-
155
-
156
-
157
-
158
-
159
-
160
-
161
-
162
-
163
-
164
-
165
-
166
-
167
-
168
-
169
-
170
-
171
-
172
-
173
-
174
-
175
-
176
-
177
-
178
-
179
-
180
-
181
-
182
-
183
-
184
-
185
-
186
-
187
-
188
-
189
-
190
-
191
-
192
-
193
-
194
-
195
-
196
-
197
-
198
-
199
-
200
-
201
-
202
-
203
-
204
-
205
-
206
-
207
-
 208
208 -
 209
209 -
 210
210 -
 211
211 -
 212
212 -
 213
213 -
 214
214 -
 215
215 -
 216
216 -
 217
217 -
 218
218 -
 219
219 -
 220
220 -
 221
221 -
 222
222 -
 223
223 -
 224
224 -
 225
225 -
 226
226 -
 227
227 -
 228
228 -
229
-
230
-
231
-
232
-
233
-
234
-
235
-
236
-
237
-
238
-
239
-
240
-
241
-
242
-
243
-
244
-
245
-
246
-
247
-
248
-
249
-
250
-
251
-
252
-
253
-
254
-
255
-
256
-
257
-
258
-
259
-
260
-
261
-
262
-
263
-
264
-
265
-
266
-
267
-
268
-
269
-
270
-
271
-
272
-
273
-
274
-
275
-
276
-
277
-
278
-
279
-
280
-
281
-
282
-
283
-
284
-
285
-
286
-
287
-
288
-
289
-
290
-
291
-
292
-
293
-
294
-
295
-
296
-
297
-
298
 |
 |

CAPITAL ONE FINANCIAL CORPORATION
NOTES TO CONSOLIDATED STATEMENTS—(Continued)
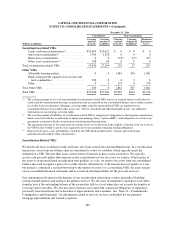
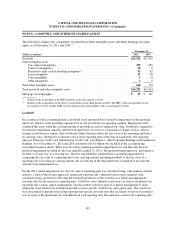
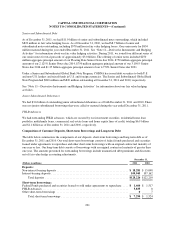
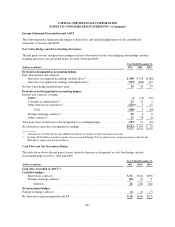
Mortgage Servicing Rights
MSRs are recognized at fair value when mortgage loans are sold or securitized in the secondary market and the
right to service these loans is retained for a fee. MSRs are recorded at fair value and changes in fair value are
recorded as a component of mortgage servicing and other income. We may enter into derivatives to economically
hedge changes in fair value of MSRs. We have no other loss exposure on MSRs in excess of the recorded fair
value.
We continue to operate the mortgage servicing business and to report the changes in the fair value of MSRs in
continuing operations. To evaluate and measure fair value, the underlying loans are stratified based on certain
risk characteristics, including loan type, note rate and investor servicing requirements.
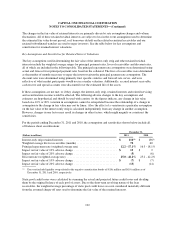
The following table sets forth the changes in the fair value of MSRs during the year ended December 31, 2011
and 2010:
December 31,
(Dollars in millions) 2011 2010
Balance at beginning of period ................................................. $ 141 $ 240
Originations ................................................................ 912
Sales ...................................................................... 0(42)
Change in fair value, net ...................................................... (57) (69)
Balance at end of period ...................................................... $ 93 $ 141
Ratio of mortgage servicing rights to related loans serviced for others .................. 0.62% 0.71%
Weighted average service fee .................................................. $0.28 $0.28
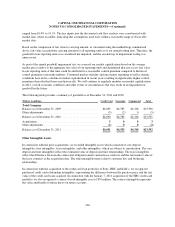
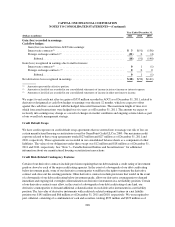
MSR fair value adjustments in 2011 and 2010 included decreases of $13 million and $28 million, respectively,
due to run-off and cash collections, and decreases of $44 million and $41 million, respectively, due to changes in
the valuation inputs and assumptions.
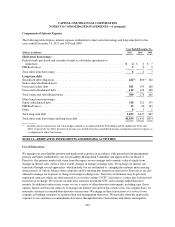
The significant assumptions used in estimating the fair value of the MSRs as of December 31, 2011 and 2010
were as follows:
December 31,
2011 2010
Weighted average prepayment rate (includes default rate) .............................. 18.62% 14.25%
Weighted average life (in years) .................................................. 4.84 6.07
Discount rate ................................................................. 11.69% 10.23%
The increase in the weighted average prepayment rate and the corresponding decrease in weighted average life,
were both driven by an increase in involuntary attrition due to market conditions and changes in model
assumptions.
At December 31, 2011, the sensitivities to immediate 10% and 20% increases in the weighted average
prepayment rates would decrease the fair value of mortgage servicing rights by $5 million and $9 million,
respectively.
At December 31, 2011, the sensitivities to immediate 10% and 20% adverse changes in servicing costs would
decrease the fair value of mortgage servicing rights by $8 million and $18 million, respectively.
198