Capital One 2011 Annual Report Download - page 95
Download and view the complete annual report
Please find page 95 of the 2011 Capital One annual report below. You can navigate through the pages in the report by either clicking on the pages listed below, or by using the keyword search tool below to find specific information within the annual report.-
 1
1 -
2
-
3
-
4
-
5
-
6
-
7
-
8
-
9
-
10
-
11
-
12
-
13
-
14
-
15
-
16
-
17
-
18
-
19
-
20
-
21
-
22
-
23
-
24
-
25
-
26
-
27
-
28
-
29
-
30
-
31
-
32
-
33
-
34
-
35
-
36
-
37
-
38
-
39
-
40
-
41
-
42
-
43
-
44
-
45
-
46
-
47
-
48
-
49
-
50
-
51
-
52
-
53
-
54
-
55
-
56
-
57
-
58
-
59
-
60
-
61
-
62
-
63
-
64
-
65
-
66
-
67
-
68
-
69
-
70
-
71
-
72
-
73
-
74
-
75
-
76
-
77
-
78
-
79
-
80
-
81
-
82
-
83
-
84
-
 85
85 -
 86
86 -
 87
87 -
 88
88 -
 89
89 -
 90
90 -
 91
91 -
 92
92 -
 93
93 -
 94
94 -
 95
95 -
 96
96 -
 97
97 -
 98
98 -
 99
99 -
 100
100 -
 101
101 -
 102
102 -
 103
103 -
 104
104 -
 105
105 -
106
-
107
-
108
-
109
-
110
-
111
-
112
-
113
-
114
-
115
-
116
-
117
-
118
-
119
-
120
-
121
-
122
-
123
-
124
-
125
-
126
-
127
-
128
-
129
-
130
-
131
-
132
-
133
-
134
-
135
-
136
-
137
-
138
-
139
-
140
-
141
-
142
-
143
-
144
-
145
-
146
-
147
-
148
-
149
-
150
-
151
-
152
-
153
-
154
-
155
-
156
-
157
-
158
-
159
-
160
-
161
-
162
-
163
-
164
-
165
-
166
-
167
-
168
-
169
-
170
-
171
-
172
-
173
-
174
-
175
-
176
-
177
-
178
-
179
-
180
-
181
-
182
-
183
-
184
-
185
-
186
-
187
-
188
-
189
-
190
-
191
-
192
-
193
-
194
-
195
-
196
-
197
-
198
-
199
-
200
-
201
-
202
-
203
-
204
-
205
-
206
-
207
-
208
-
209
-
210
-
211
-
212
-
213
-
214
-
215
-
216
-
217
-
218
-
219
-
220
-
221
-
222
-
223
-
224
-
225
-
226
-
227
-
228
-
229
-
230
-
231
-
232
-
233
-
234
-
235
-
236
-
237
-
238
-
239
-
240
-
241
-
242
-
243
-
244
-
245
-
246
-
247
-
248
-
249
-
250
-
251
-
252
-
253
-
254
-
255
-
256
-
257
-
258
-
259
-
260
-
261
-
262
-
263
-
264
-
265
-
266
-
267
-
268
-
269
-
270
-
271
-
272
-
273
-
274
-
275
-
276
-
277
-
278
-
279
-
280
-
281
-
282
-
283
-
284
-
285
-
286
-
287
-
288
-
289
-
290
-
291
-
292
-
293
-
294
-
295
-
296
-
297
-
298
 |
 |

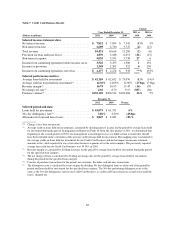
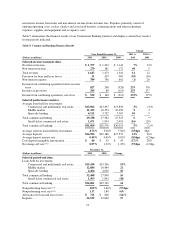
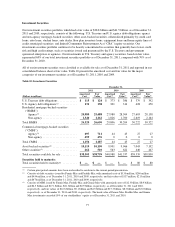
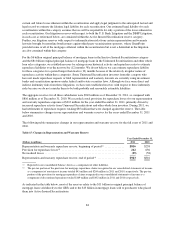
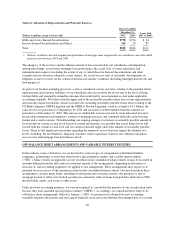
** Change is less than one percent.
(1) Average loans held for investment used in the denominator in calculating net charge-off, delinquency and nonperforming
loan and nonperforming asset rates includes the impact of loans acquired as part of the Chevy Chase Bank acquisition,
which were considered purchased credit-impaired (“PCI”) loans. However, we separately track and report PCI loans and
exclude these loans from our net charge-off, delinquency, nonperforming loan and nonperforming asset rates.
(2) The net charge-off rate is calculated by loan category by dividing net charge-offs for the period by average loans held for
investment during the period for the specified loan category. The net charge-off rate, excluding loans acquired from
Chevy Chase Bank from the denominator, was 0.58%, 1.35% and 1.48% in 2011, 2010 and 2009, respectively.
(3) The nonperforming loan rate is calculated by loan category by dividing nonperforming loans as of the end of the period
by period-end loans held for investment for the specified loan category. The nonperforming loan rate, excluding the
impact of loans acquired from Chevy Chase Bank from the denominator, was 1.11% and 1.69% as of December 31, 2011
and 2010, respectively.
(4) The nonperforming asset rate is calculated by loan category by dividing nonperforming assets as of the end of the period
by period-end loans held for investment and REO for the specified loan category. The nonperforming asset rate,
excluding loans acquired from Chevy Chase Bank from the denominator, was 1.19% and 1.83% as of December 31,
2011 and 2010, respectively.
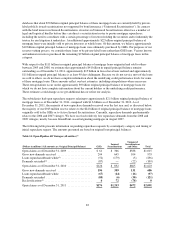
Key factors affecting the results of our Commercial Banking business for 2011, compared with 2010 included the
following:
•Net Interest Income: Net interest income increased by $85 million, or 7% in 2011. The primary drivers of
the increase in net interest income from 2010 were an increase in average loans and average deposits and
continued improvement in deposit pricing.
•Non-Interest Income: Non-interest income increased by $89 million, or 49% in 2011. The increase in
non-interest income was largely attributable to growth in fees in the middle market business and the absence
of a loss of $18 million recognized in the third quarter of 2010 from the sale of a legacy portfolio of small-
ticket commercial real estate loans.
•Provision for Loan and Lease Losses: The provision for loan and lease losses decreased by $398 million in
2011. The lower provision in 2011 was attributable to lower loss severities resulting from improvements in
underlying collateral asset values. As a result, we reduced the allowance related to the Commercial Banking
business by $146 million. In comparison, we increased the allowance by $41 million in 2010.
•Non-Interest Expense: Non-interest expense of $789 million in 2011 was flat relative to 2010 despite an
increase in loan volume, reflecting operational efficiency improvements and a reduction in integration costs
related to the Chevy Chase Bank acquisition.
•Total Loans: Period-end loans increased by $4.3 billion, or 14%, in 2011 to $34.0 billion as of
December 31, 2011, from $29.7 billion as of December 31, 2010. The increase was driven by stronger loan
originations in the middle market and commercial real estate businesses, which was partially offset by the
run-off and sale of a portion of the small-ticket commercial real estate loan portfolio.
•Deposits: Period-end deposits in the Commercial Banking business increased by $3.9 billion, or 17%, in
2011 to $26.5 billion as of December 31, 2011, driven by our strategy to strengthen existing relationships
and increase liquidity from commercial customers.
•Charge-off and Nonperforming Loan Statistics: The net charge-off rate decreased to 0.57% in 2011, from
1.32% in 2010. The nonperforming loan rate decreased to 1.09% as of December 31, 2011, from 1.66% as
of December 31, 2010. The improvement in the net charge-off and nonperforming loan rates was
attributable to slowly improving underlying credit trends and improvements in underlying collateral asset
values.
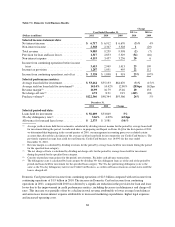
Key factors affecting the results of our Commercial Banking business for 2010, compared with 2009 included the
following:
•Net Interest Income: Net interest income increased by $148 million, or 13%, in 2010. The increase was
driven by strong average deposit growth, improved deposit spreads resulting from repricing of higher rate
75