Capital One 2011 Annual Report Download - page 134
Download and view the complete annual report
Please find page 134 of the 2011 Capital One annual report below. You can navigate through the pages in the report by either clicking on the pages listed below, or by using the keyword search tool below to find specific information within the annual report.-
 1
1 -
2
-
3
-
4
-
5
-
6
-
7
-
8
-
9
-
10
-
11
-
12
-
13
-
14
-
15
-
16
-
17
-
18
-
19
-
20
-
21
-
22
-
23
-
24
-
25
-
26
-
27
-
28
-
29
-
30
-
31
-
32
-
33
-
34
-
35
-
36
-
37
-
38
-
39
-
40
-
41
-
42
-
43
-
44
-
45
-
46
-
47
-
48
-
49
-
50
-
51
-
52
-
53
-
54
-
55
-
56
-
57
-
58
-
59
-
60
-
61
-
62
-
63
-
64
-
65
-
66
-
67
-
68
-
69
-
70
-
71
-
72
-
73
-
74
-
75
-
76
-
77
-
78
-
79
-
80
-
81
-
82
-
83
-
84
-
85
-
86
-
87
-
88
-
89
-
90
-
91
-
92
-
93
-
94
-
95
-
96
-
97
-
98
-
99
-
100
-
101
-
102
-
103
-
104
-
105
-
106
-
107
-
108
-
109
-
110
-
111
-
112
-
113
-
114
-
115
-
116
-
117
-
118
-
119
-
120
-
121
-
122
-
123
-
 124
124 -
 125
125 -
 126
126 -
 127
127 -
 128
128 -
 129
129 -
 130
130 -
 131
131 -
 132
132 -
 133
133 -
 134
134 -
 135
135 -
 136
136 -
 137
137 -
 138
138 -
 139
139 -
 140
140 -
 141
141 -
 142
142 -
 143
143 -
 144
144 -
145
-
146
-
147
-
148
-
149
-
150
-
151
-
152
-
153
-
154
-
155
-
156
-
157
-
158
-
159
-
160
-
161
-
162
-
163
-
164
-
165
-
166
-
167
-
168
-
169
-
170
-
171
-
172
-
173
-
174
-
175
-
176
-
177
-
178
-
179
-
180
-
181
-
182
-
183
-
184
-
185
-
186
-
187
-
188
-
189
-
190
-
191
-
192
-
193
-
194
-
195
-
196
-
197
-
198
-
199
-
200
-
201
-
202
-
203
-
204
-
205
-
206
-
207
-
208
-
209
-
210
-
211
-
212
-
213
-
214
-
215
-
216
-
217
-
218
-
219
-
220
-
221
-
222
-
223
-
224
-
225
-
226
-
227
-
228
-
229
-
230
-
231
-
232
-
233
-
234
-
235
-
236
-
237
-
238
-
239
-
240
-
241
-
242
-
243
-
244
-
245
-
246
-
247
-
248
-
249
-
250
-
251
-
252
-
253
-
254
-
255
-
256
-
257
-
258
-
259
-
260
-
261
-
262
-
263
-
264
-
265
-
266
-
267
-
268
-
269
-
270
-
271
-
272
-
273
-
274
-
275
-
276
-
277
-
278
-
279
-
280
-
281
-
282
-
283
-
284
-
285
-
286
-
287
-
288
-
289
-
290
-
291
-
292
-
293
-
294
-
295
-
296
-
297
-
298
 |
 |

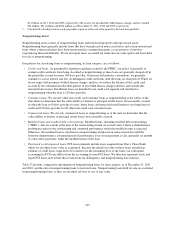
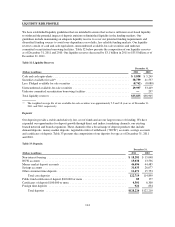
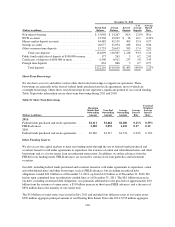
LIQUIDITY RISK PROFILE
We have established liquidity guidelines that are intended to ensure that we have sufficient asset-based liquidity
to withstand the potential impact of deposit attrition or diminished liquidity in the funding markets. Our
guidelines include maintaining an adequate liquidity reserve to cover our potential funding requirements and
diversified funding sources to avoid over-dependence on volatile, less reliable funding markets. Our liquidity
reserves consist of cash and cash equivalents, unencumbered available-for-sale securities and undrawn
committed securitization borrowing facilities. Table 32 below presents the composition of our liquidity reserves
as of December 31, 2011 and 2010. Our liquidity reserves decreased by $3.1 billion in 2011 to $35.8 billion as of
December 31, 2011.
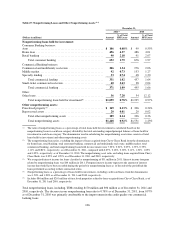
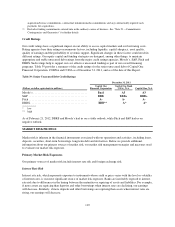
Table 32: Liquidity Reserves
December 31,
(Dollars in millions) 2011 2010
Cash and cash equivalents ..................................................... $ 5,838 $ 5,249
Securities available for sale(1) .................................................. 38,759 41,537
Less: Pledged available for sale securities ........................................ (8,762) (8,088)
Unencumbered available-for-sale securities ....................................... 29,997 33,449
Undrawn committed securitization borrowing facilities .............................. —207
Total liquidity reserves ....................................................... $35,835 $38,905
(1) The weighted average life of our available-for-sale securities was approximately 2.9 and 3.8 years as of December 31,
2011 and 2010, respectively.
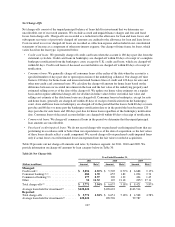
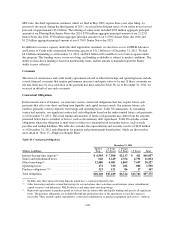
Deposits
Our deposits provide a stable and relatively low cost of funds and are our largest source of funding. We have
expanded our opportunities for deposit growth through direct and indirect marketing channels, our existing
branch network and branch expansion. These channels offer a broad range of deposit products that include
demand deposits, money market deposits, negotiable order of withdrawal (“NOW”) accounts, savings accounts
and certificates of deposit. Table 33 presents the composition of our deposits by type as of December 31, 2011
and 2010.
Table 33: Deposits
December 31,
(Dollars in millions) 2011 2010
Non-interest bearing ....................................................... $ 18,281 $ 15,048
NOW accounts ........................................................... 15,038 13,536
Money market deposit accounts .............................................. 46,496 44,485
Savings accounts .......................................................... 31,433 26,077
Other consumer time deposits ................................................ 11,471 15,753
Total core deposits .................................................... 122,719 114,899
Public fund certificates of deposit $100,000 or more .............................. 85 177
Certificates of deposit $100,000 or more ....................................... 4,501 6,300
Foreign time deposits ...................................................... 921 834
Total deposits ........................................................ $128,226 $122,210
114