Capital One 2011 Annual Report Download - page 186
Download and view the complete annual report
Please find page 186 of the 2011 Capital One annual report below. You can navigate through the pages in the report by either clicking on the pages listed below, or by using the keyword search tool below to find specific information within the annual report.-
 1
1 -
2
-
3
-
4
-
5
-
6
-
7
-
8
-
9
-
10
-
11
-
12
-
13
-
14
-
15
-
16
-
17
-
18
-
19
-
20
-
21
-
22
-
23
-
24
-
25
-
26
-
27
-
28
-
29
-
30
-
31
-
32
-
33
-
34
-
35
-
36
-
37
-
38
-
39
-
40
-
41
-
42
-
43
-
44
-
45
-
46
-
47
-
48
-
49
-
50
-
51
-
52
-
53
-
54
-
55
-
56
-
57
-
58
-
59
-
60
-
61
-
62
-
63
-
64
-
65
-
66
-
67
-
68
-
69
-
70
-
71
-
72
-
73
-
74
-
75
-
76
-
77
-
78
-
79
-
80
-
81
-
82
-
83
-
84
-
85
-
86
-
87
-
88
-
89
-
90
-
91
-
92
-
93
-
94
-
95
-
96
-
97
-
98
-
99
-
100
-
101
-
102
-
103
-
104
-
105
-
106
-
107
-
108
-
109
-
110
-
111
-
112
-
113
-
114
-
115
-
116
-
117
-
118
-
119
-
120
-
121
-
122
-
123
-
124
-
125
-
126
-
127
-
128
-
129
-
130
-
131
-
132
-
133
-
134
-
135
-
136
-
137
-
138
-
139
-
140
-
141
-
142
-
143
-
144
-
145
-
146
-
147
-
148
-
149
-
150
-
151
-
152
-
153
-
154
-
155
-
156
-
157
-
158
-
159
-
160
-
161
-
162
-
163
-
164
-
165
-
166
-
167
-
168
-
169
-
170
-
171
-
172
-
173
-
174
-
175
-
 176
176 -
 177
177 -
 178
178 -
 179
179 -
 180
180 -
 181
181 -
 182
182 -
 183
183 -
 184
184 -
 185
185 -
 186
186 -
 187
187 -
 188
188 -
 189
189 -
 190
190 -
 191
191 -
 192
192 -
 193
193 -
 194
194 -
 195
195 -
 196
196 -
197
-
198
-
199
-
200
-
201
-
202
-
203
-
204
-
205
-
206
-
207
-
208
-
209
-
210
-
211
-
212
-
213
-
214
-
215
-
216
-
217
-
218
-
219
-
220
-
221
-
222
-
223
-
224
-
225
-
226
-
227
-
228
-
229
-
230
-
231
-
232
-
233
-
234
-
235
-
236
-
237
-
238
-
239
-
240
-
241
-
242
-
243
-
244
-
245
-
246
-
247
-
248
-
249
-
250
-
251
-
252
-
253
-
254
-
255
-
256
-
257
-
258
-
259
-
260
-
261
-
262
-
263
-
264
-
265
-
266
-
267
-
268
-
269
-
270
-
271
-
272
-
273
-
274
-
275
-
276
-
277
-
278
-
279
-
280
-
281
-
282
-
283
-
284
-
285
-
286
-
287
-
288
-
289
-
290
-
291
-
292
-
293
-
294
-
295
-
296
-
297
-
298
 |
 |

CAPITAL ONE FINANCIAL CORPORATION
NOTES TO CONSOLIDATED STATEMENTS—(Continued)
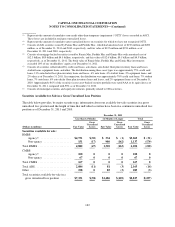
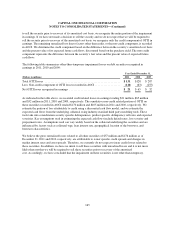
The table below presents activity for the years ended December 31, 2011, 2010 and 2009, related to the credit
component of OTTI recognized in earnings on investment debt securities for which a portion of the OTTI losses,
the non-credit component, was recorded in AOCI:
Year Ended December 31,
(Dollars in millions) 2011 2010 2009
Credit loss component, beginning of period ................................. $49 $ 32 $ 0
Additions:
Initial credit impairment ............................................ 312(2) 25
Subsequent credit impairment ........................................ 18 17 7
Total additions ................................................ 21 29 32
Reductions:
Sales of credit-impaired securities ..................................... (2) (4) 0
Change in intent to sell or requirement to sell(1) .......................... 0(8) 0
Total reductions ............................................... (2) (12) 0
Ending balance ........................................................ $68 $ 49 $32
(1) We recognized $36 million of OTTI losses on securities for which no portion of the OTTI losses remained in AOCI in
2010. We did not recognize OTTI losses on securities for which no portion of the OTTI losses remained in AOCI in
2011 and 2009.
(2) Includes $4 million of OTTI losses recognized in earnings in the first quarter of 2010 on negative amortization bonds
classified as held to maturity.
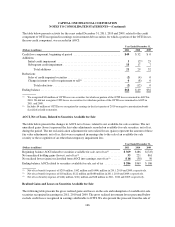
AOCI, Net of Taxes, Related to Securities Available for Sale
The table below presents the changes in AOCI, net of taxes, related to our available-for-sale securities. The net
unrealized gains (losses) represent the fair value adjustments recorded on available-for-sale securities, net of tax,
during the period. The net reclassification adjustment for net realized losses (gains) represent the amount of those
fair value adjustments, net of tax, that were recognized in earnings due to the sale of an available-for-sale
security or the recognition of an other-than-temporary impairment loss.
Year Ended December 31,
(Dollars in millions) 2011 2010 2009
Beginning balance AOCI related to securities available for sale, net of tax(1) ....... $ 369 $186 $(725)
Net unrealized holding gains (losses), net of tax(2) ............................ 33 221 861
Net realized losses (gains) reclassified from AOCI into earnings, net of tax(3) ...... (116) (38) 50
Ending balance AOCI related to securities available for sale, net of tax ........... $ 286 $369 $ 186
(1) Net of tax benefit (expense) of $203 million, $102 million and $(404) million in 2011, 2010 and 2009, respectively.
(2) Net of tax benefit (expense) of $18 million, $122 million and $480 million in 2011, 2010 and 2009, respectively.
(3) Net of tax (benefit) expense of $(64) million, $(21) million and $28 million in 2011, 2010 and 2009, respectively.
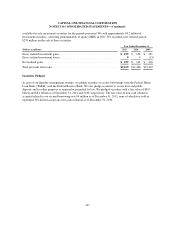
Realized Gains and Losses on Securities Available for Sale
The following table presents the gross realized gains and losses on the sale and redemption of available-for-sale
securities recognized in earnings in 2011, 2010 and 2009. The gross realized investment losses presented below
exclude credit losses recognized in earnings attributable to OTTI. We also present the proceeds from the sale of
166